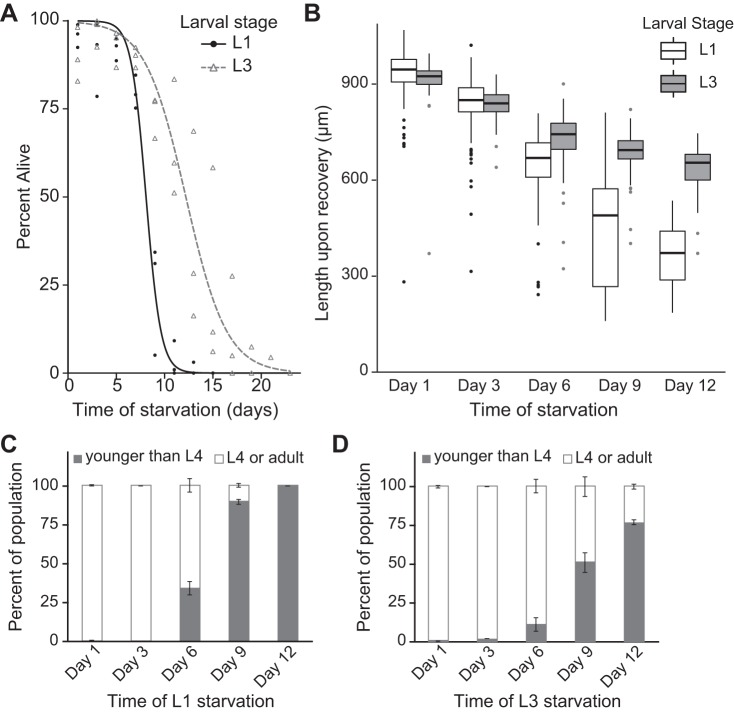
Fig. 3.
L3 larvae are more starvation resistant than L1 larvae. A: starvation survival is plotted for L1 and L3 larvae. L3 larvae survive starvation longer than L1 larvae. (P = 0.04, n = 3 biological replicates). B: worm length is plotted after growth upon feeding from the indicated time of L1 or L3 larval starvation. Larvae were recovered for 48 h after L1 starvation and for 24 h after L3 starvation because larvae in L3 arrest were fed for 24 h before starvation so that both were fed for 48 h total. Worms starved at the L1 stage are significantly shorter after 48 h of feeding (P = 0.0002, 1-way ANOVA, n = 3 biological replicates). Worms starved at the L3 stage are also significantly smaller after 24 h of recovery from extended starvation (P < 0.0001, 1-way ANOVA, n = 3 biological replicates). There is a significant interaction between the L1 and L3 reaction norms of size after recovery from starvation (P = 0.005, 2-way ANOVA, n = 3 biological replicates). Boxes are bounded by the upper and lower quartiles and also depict the median. Whiskers represent the minimum and maximum values within 1.5× interquartile range. Individual points depict outliers. C: percentage of worms reaching at least the L4 larval stage after 48 h of development from the indicated duration of L1 arrest is plotted. There is a marginally significant reduction in the number of worms that recover to at least the L4 stage (P = 0.07, Kruskal-Wallis test, n = 2). D: percentage of worms reaching at least the L4 stage after 24 h of feeding from the indicated duration of L3 larval arrest is plotted. Following starvation, there is a reduction in the number of worms that recover to at least the L4 stage (P < 0.0001, 1-way ANOVA, n = 2). The percentage of worms recovering to at least the L4 stage was significantly reduced (relative to recovery from 1 day of starvation) at days 9 and 12 (P < 0.001 in both cases, Tukey’s honestly significant difference test). Mean and SE values are depicted in C and D.

