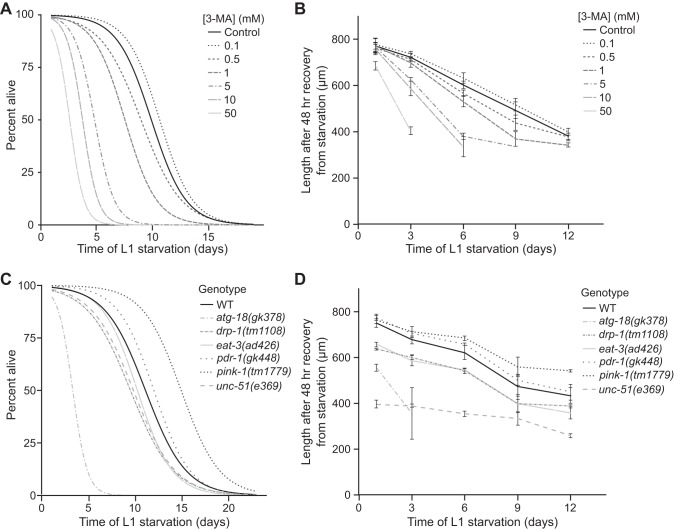
Fig. 6.
Blocking autophagy reduces starvation survival and delays recovery from extended starvation. A: L1 starvation survival is plotted for worms exposed to a range of concentrations of the autophagy inhibitor 3-methyladenine (3-MA). B: size after 48 h of feeding and growth following the indicated period of starvation is shown for worms exposed to a range of concentrations of 3-MA. C: L1 starvation survival is plotted for various genotypes. atg-18 and unc-51 mutants were short-lived during starvation (P = 7.4E-6, 0.02, respectively). pink-1 mutants were significantly long-lived during starvation (P = 0.001). D: size upon recovery from starvation is shown for the same genotypes as in C. atg-18 mutants were shorter upon recovery from starvation relative to wild-type (WT) (2-way ANOVA genotype comparison P = 2.3E-5, interaction term P = 0.06). Similarly, unc-51 mutants were also shorter than WT worms (2-way ANOVA, genotype comparison P = 1.9E-14). pink-1 mutants were significantly longer than WT (2-way ANOVA genotype comparison P = 0.002, interaction term P = 0.07). In B and D mean values and SE are shown.

