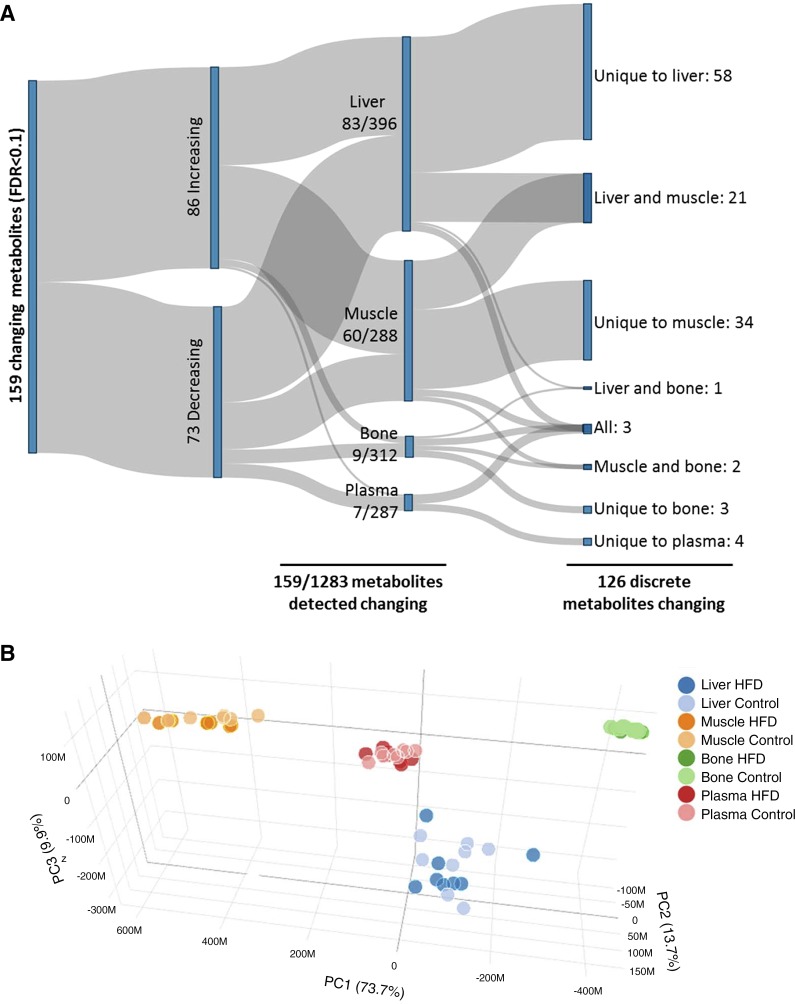
Fig. 2.
Summary of metabolite profiles identified for liver, muscle, bone, and plasma from high-fat diet (HFD)-fed compared with chow diet (CD)-fed mice. A: overall, 159 significant changes were observed across all tissues to 126 discrete species of metabolite in HFD-fed animals compared with controls [false discovery rate (FDR) < 0.1]. Changes were primarily in highly metabolically active tissues (muscle and liver), whereas bone and plasma were relatively resistant to changes associated with high-fat diet. B: principal component (PC) analysis: sample profiles were assessed by partial least squares-discriminant analysis (PLS-DA) regression analysis of HMDB metabolites. Permutation analysis revealed significant differentiation of the tissue clusters (P < 0.001). Metabolites not detected in at least two tissues were removed from the plot. Liver and muscle exhibited the largest spread across PC1 which accounted for the majority of the variation (73.7%). When assessed individually by PLS-DA, there was no difference in overall profile by diet for the four tissues.

