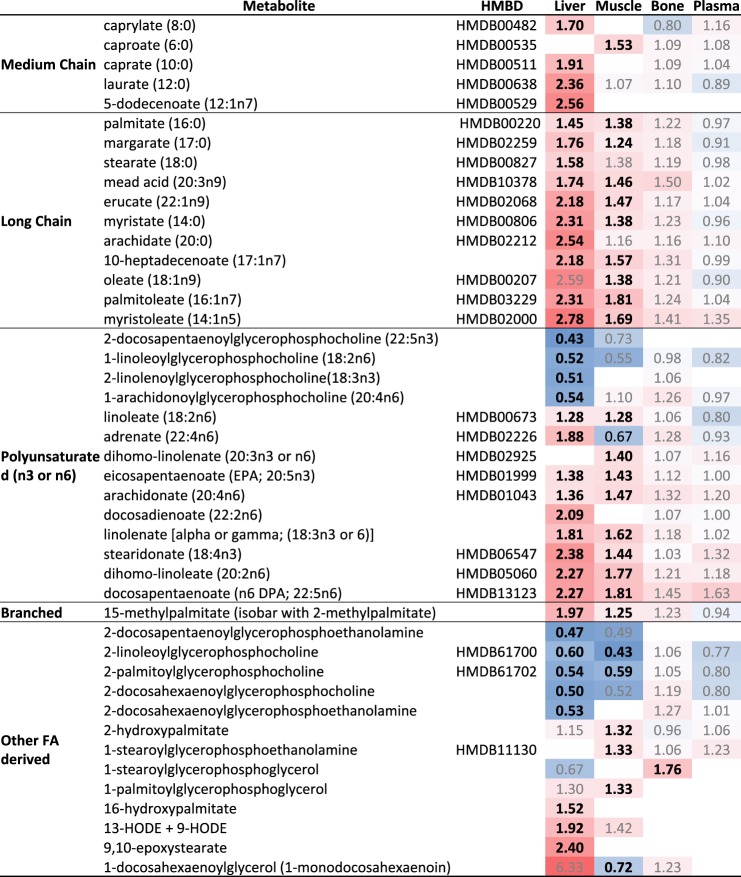
Fig. 3.
Heat map summary of fatty acid metabolite changes in high-fat diet (HFD)-fed mice compared with chow diet (CD)-fed controls. Fold change indicated with significant changes (P < 0.05, FDR<0.1) are designated by bold, whereas nonsignificant are annotated by gray. Heat map is colored by relative scale of change across all tissues and metabolites. Darker shades of red show increases while darker shades of blue show decreases.

