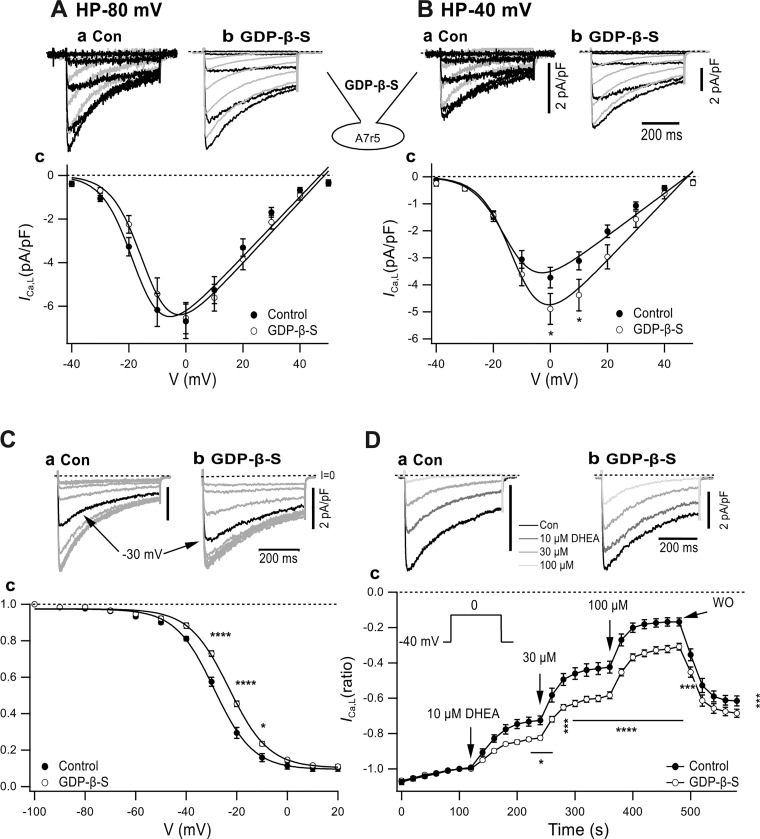
Fig. 7.
Effect of guanosine 5′-O-(2-thiodiphosphate) (GDP-β-S) dialysis on current-voltage (I-V) and quasi-steady-state inactivation curve (f∞-V) relationships and dehydroepiandrosterone (DHEA)-induced inhibition of L-type Ca2+ current (ICa,L). A and B: effect of GDP-β-S on I-V obtained at HPs of −80 mV (A) and −40 mV (B). a and b: Typical records from a control cell (a) and GDP-β-S-dialyzed cell (b). Darker traces show depolarization pulses to −40–0 mV; lighter traces show 10–40 mV. Ac: I-V from a HP of −80 mV. Bc: I-V from a HP of −40 mV. *P < 0.05. I-V relationships were fitted with Boltzmann’s equation along with the parameters shown in Table 1. C: effect of GDP-β-S on f∞-V relationships obtained by 2-s prepulses. a and b: Typical traces. c: f∞-V. n and fitting parameters are shown in Table 3. *P < 0.05; ****P < 0.0001. D: effect of GDP-β-S on DHEA-induced inhibition of ICa,L. a and b: Typical records. c: Normalized ICa,L,peak plotted versus time. *P < 0.05; **P < 0.01; ***P < 0.001; ****P < 0.0001, GDP-β-S compared with control. All statistical comparisons were done with two-way ANOVA followed by Sidak’s test.

