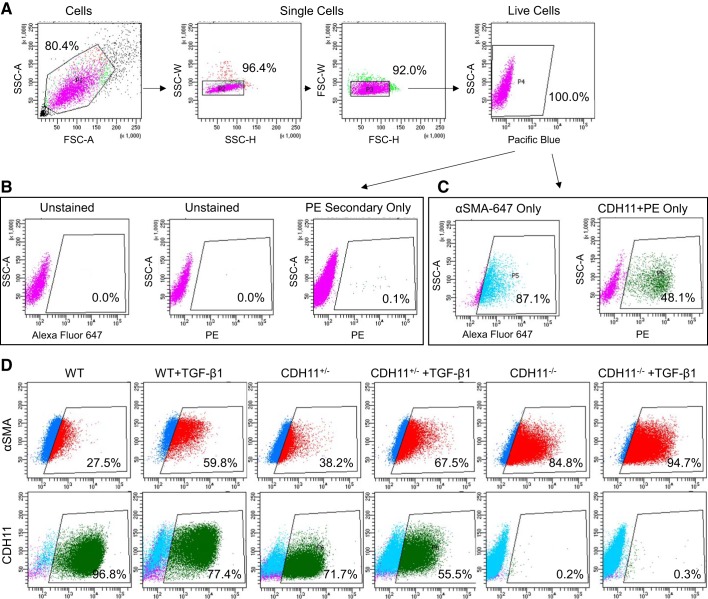
Fig. 4.
FACS gating strategy. Representative dot plots are shown for the FACS gating strategy used to evaluate cadherin (CDH11) stained with PE and smooth muscle α-actin (α-SMA) conjugated to Alexa Fluor 647. Live single cells were isolated by shape and DAPI staining (Pacific blue) (A). Negative controls of unstained and secondary only were used to set gates with few to no false positive events (B). Stained cells showed a 100- or 1,000-fold increase in fluorescence intensity (C). Representative FACS dot plots are shown for α-SMA and CDH11 with positive cells inside the gate (D). TGF-β1, transforming growth factor-β1; WT, wild-type; SSC-A/H/W, side scatter-area/height/width; FSC-A/H/W; forward scatter-area/height/width.

