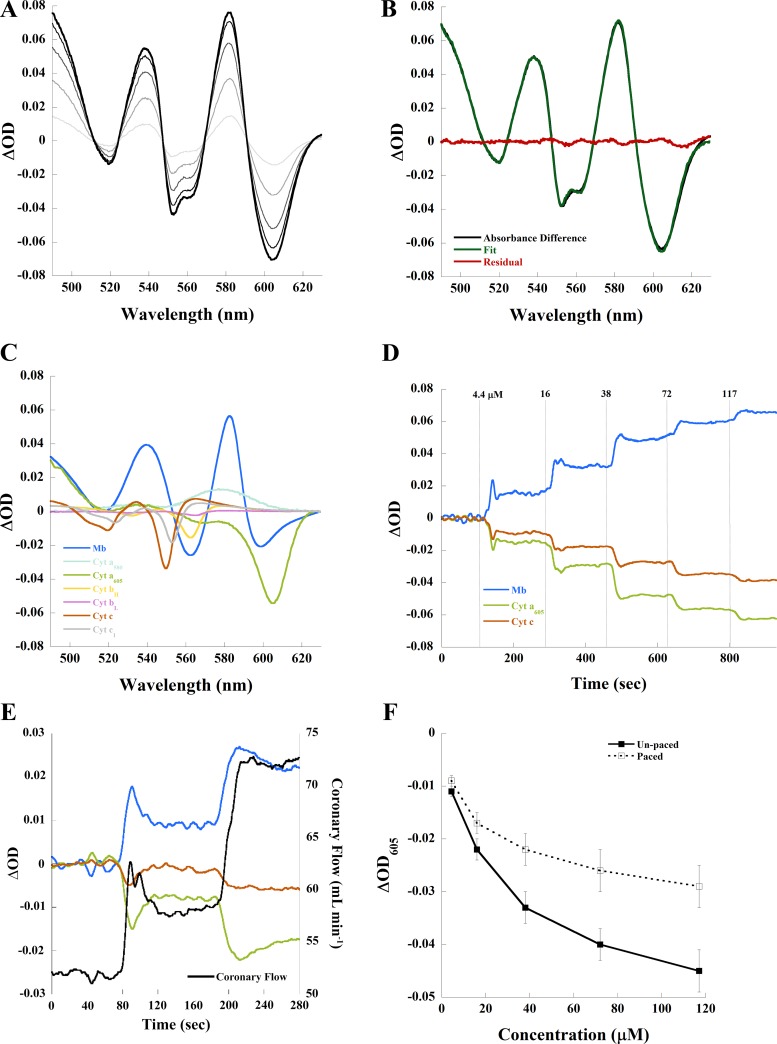
Fig. 2.
Changes in myocardial absorbance of the perfused rabbit heart due to adenosine. A: adenosine resulted in dose-dependent changes in absorbance difference spectrum compared with control in this unpaced example. Adenosine (4.4 µM) is represented by light grey, and 117 µM adenosine is represented by black. B: absorbance difference (black) between 72 µM adenosine and control, linear least-squares regression fit (green) of the absorbance difference, and residual (red) of the spectral fit. C: contribution of each chromophore to the spectral fit. D: time course of myoglobin (Mb), cytochrome (Cyt) c, and Cyt aa3 absorbance compared with control in an unpaced experiment. E: time course of Mb, Cyt c, and Cyt aa3 absorbance compared with paced control and coronary flow for first two doses of adenosine in a paced experiment. F: effect of adenosine on steady-state ΔOD605 (Cyt aa3) with and without pacing. OD, optical density.

