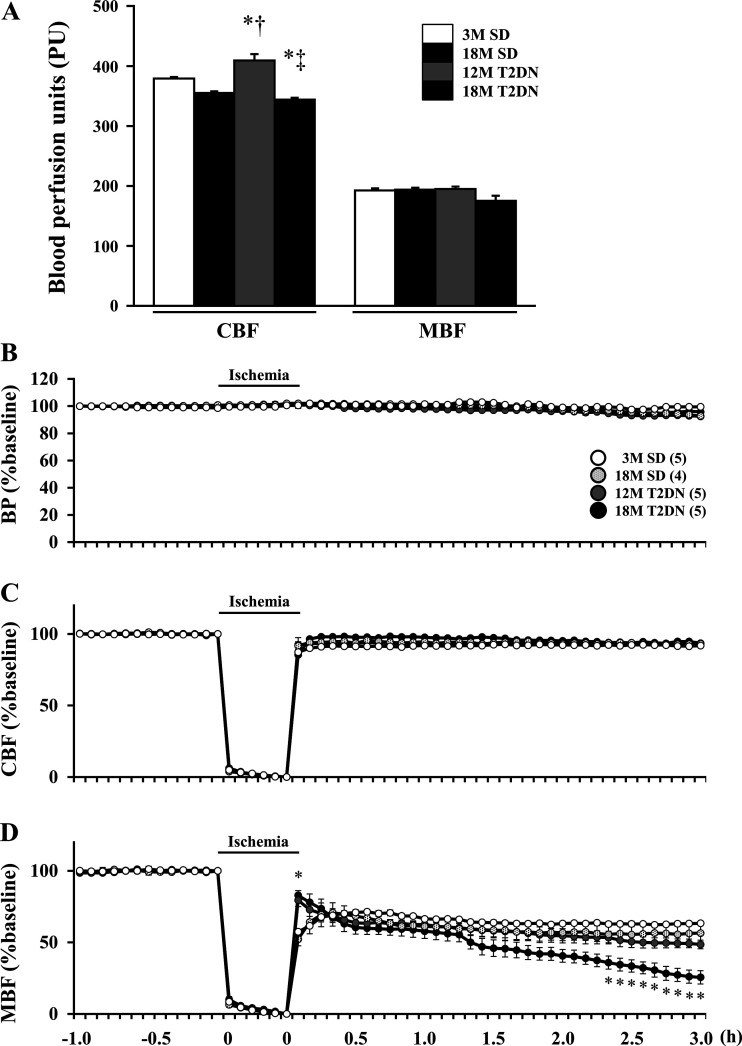
Fig. 5.
Comparison of baseline cortical and medullary blood flow (CBF and MBF) signals and time course of changes in CBF and MBF following IR in SD and T2DN rats. A–D: CBF and MBF were measured by laser Doppler flowmetry and mean arterial pressure (BP) was measured in SD and T2DN rats during a control period, during a 30 min bilateral ischemia period, and for 3 h of reperfusion. Mean values ± 1 SE from 4–5 rats per group are presented. *P < 0.05 compared with the corresponding value in 3M SD rats. †P < 0.05 compared with the corresponding value in 18M SD rats. ‡P < 0.05 compared with the corresponding value in 12M T2DN rats. 3M, 3 mo old; 12 M, 12 mo old; 18M, 18 mo old; IR, ischemia-reperfusion; SD, Sprague-Dawley; T2DN, type 2 diabetic nephropathy rat.

