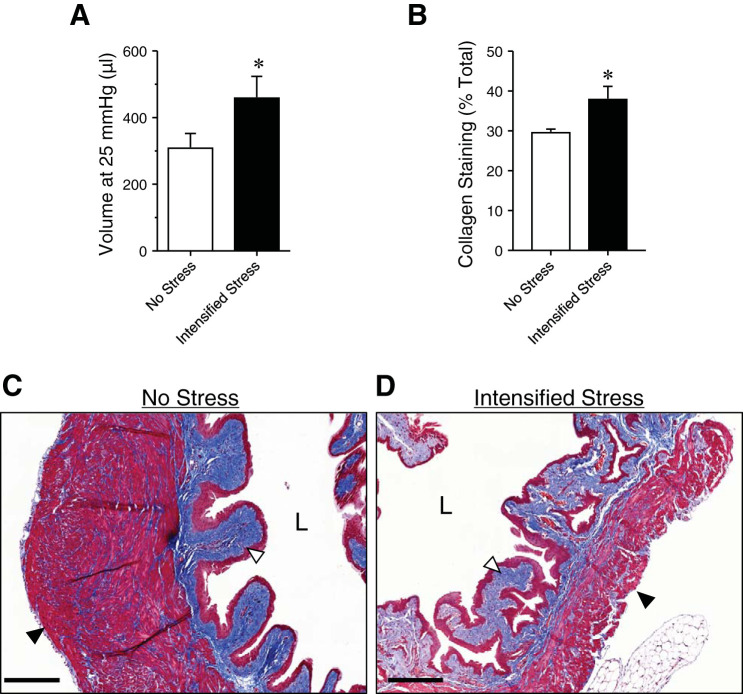
Fig. 3.
Ex vivo bladder capacity and collagen deposition are increased in intensified stress mice. Bar graph (A) showing ex vivo bladder capacity (at 25 mmHg) in unstressed and intensified stress mice. Summary graph (B) and representative images of Masson trichrome staining of bladder sections from unstressed (C) and intensified stress (D) mice, showing increased collagen deposition (blue; white arrow) and a decrease in smooth muscle (red; black arrow). Representative of samples from 6 mice. Scale bar = 200 µm. *P ≤ 0.05; n = 5 mice. L, bladder lumen.

