Fig. 2.
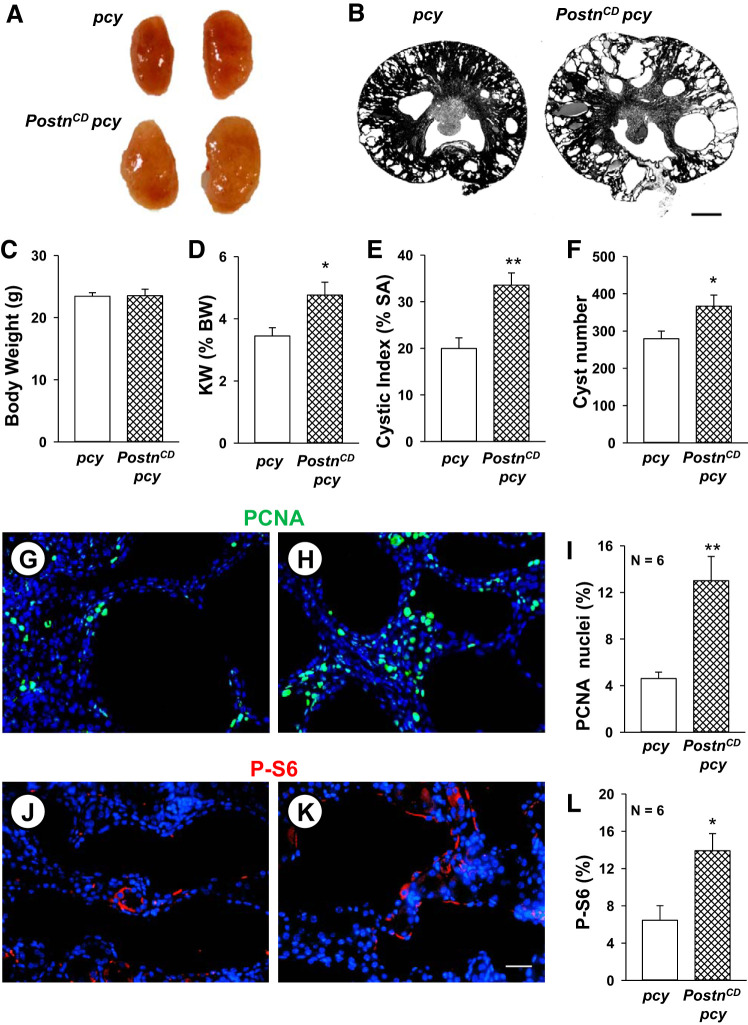
CD-specific periostin expression accelerates mammalian target of rapamycin (mTOR)-mediated cell proliferation and cyst growth in pcy kidneys. Representative whole kidneys (A) and kidney sections (B) from 10-wk-old pcy and PostnCD pcy mice. Scale bar: 1 mm. Bar graphs show means ± SE for body weight (BW) (C), kidney weight (KW) as a percentage of BW, indicated as KW (%BW) (D), percentage of cystic area per total cross-sectional surface area (% SA) (E) and cyst number per kidney section (F) of pcy (n = 6) and PostnCD pcy (n = 8) mice. pcy (G, J) and PostnCD pcy (H, K) kidney sections were stained for PCNA (green) (G, H) or phosphorylated S6 (P-S6; red) and nuclear stain DAPI (blue) (J, K). Percentage of PCNA-positive nuclei (I) and the percentage of P-S6-positive cells (L) normalized to total nuclei. *P < 0.05 and **P < 0.01, compared with pcy. Scale bars: 5 µm.

