Fig. 4.
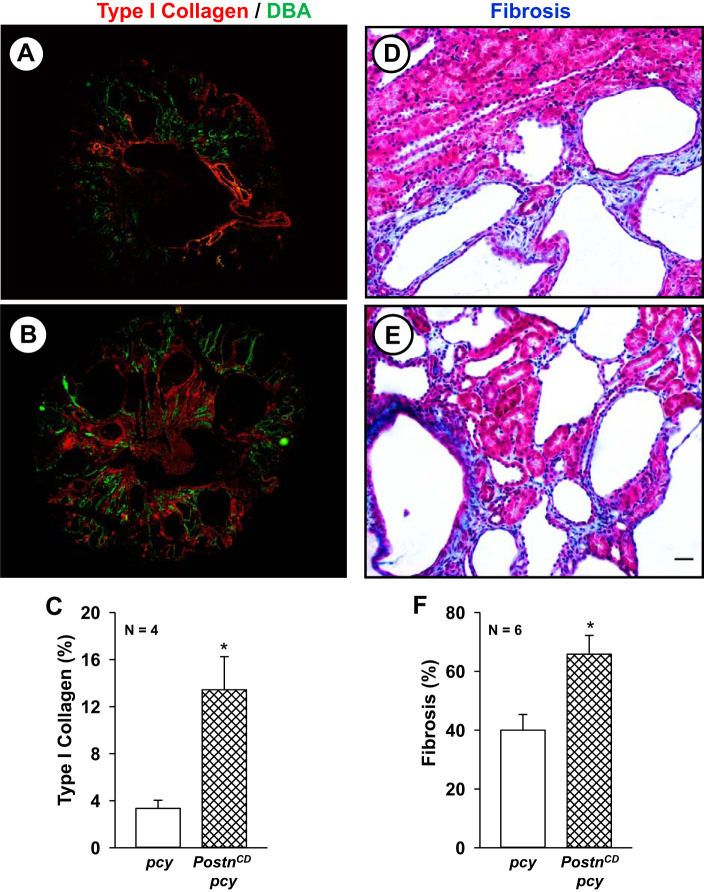
Collecting duct (CD)-specific expression of periostin increases renal type I collagen and interstitial fibrosis in pcy mice. Representative sections from pcy (A) and PostnCD pcy (B) mice stained with antibodies to type I collagen (red) and Dolichos biflorus agglutinin (DBA; green). C: bar graph (means ± SE) represents the percentage of entire tissue sections that stained for type I collagen (n = 4), normalized to total surface area (SA). Representative sections from pcy (D) and PostnCD pcy (E) mice were stained with Masson’s trichrome to visualize collagen fibers (blue) and prefibrotic edematous areas characterized by an increase in spacing between tubules (pale blue) (67). F: tissue sections were scored by a naïve observer assigning a percentage of fibrotic/edematous cortical area per total area of the cortex. Bar graph represents fibrosis as a percentage of total sectional area. *P < 0.05, compared with pcy. Scale bar: 5 µm.

