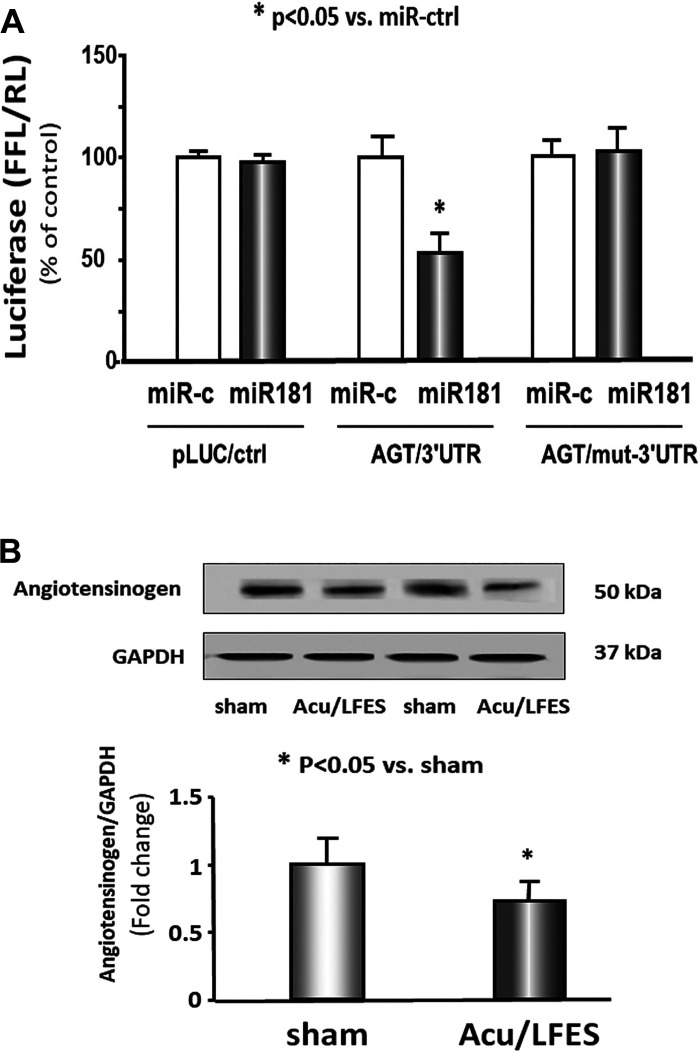
Fig. 5.
miR-181 directly targets 3′-untranlasted region (UTR) of angiotensinogen (AGT) and inhibits translation. A: 293HEK cells were transfected with luciferase pLucctrl vector (left) or the vector containing the 3′-UTR of AGT (pMIR-AGT/433-440) (middle) or a vector containing a mutated 3′-UTR of AGT (pMIR-mut-AGT) (right). Cells were cotransfected with control mimic (white bars) or miR-181 mimic (black bars). Luciferase activity in cells that received the pLucctrl with miR-ctrl was designated as the 100% (far left white bar). The other bars show the response to miR181 expressed as a percentage of this control. Triplicate determinations were made in each condition and each experiment was repeated a total of three times; the firefly luciferase (FFL) results were normalized by renilla luciferase (RL) activity (data are means ± SE; n = 9; *P < 0.05 vs. AGT/3′-UTR + miR-ctrl). B: protein was isolated from the kidney of sham and Acu/LFES-treated mice. Angiotensinogen in tissue lysates was measured by Western blots. The bar graph shows the fold change of the Angiotensinogen protein band compared with levels in sham-treated group represented by 1-fold. All protein band densities have been normalized to their corresponding GAPDH loading control. (bars: means ± SE; n = 9/group; *P < 0.05 vs. sham).

