Fig. 3.
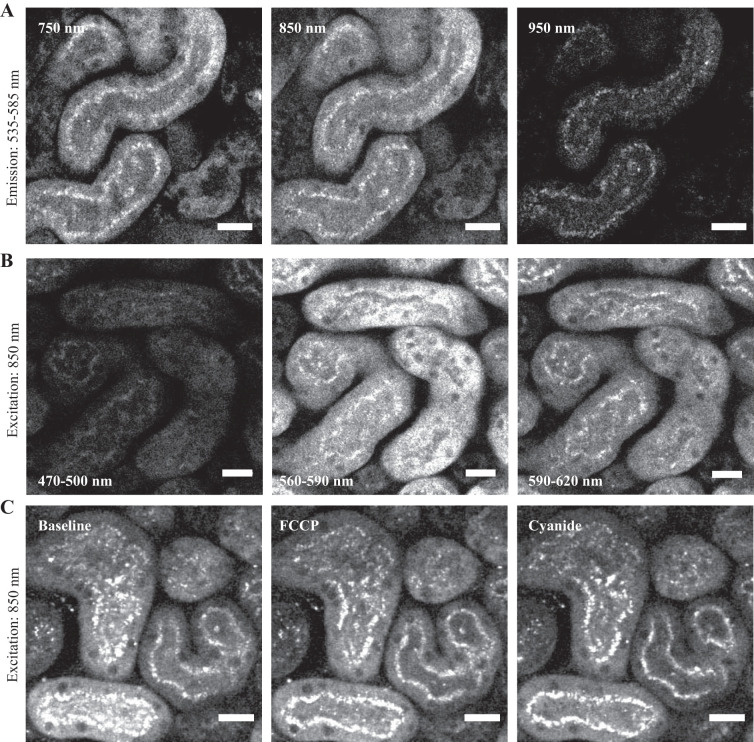
Characterization of flavoprotein (FP) signals in kidney tissue. A: mitochondrial FP signals (emission 535–585 nm) in proximal tubules in kidney cortex slices were excited at both 750 and 850 nm. However, the signal was considerably dimmer at 950 nm. B: at an excitation wavelength of 850 nm the peak FP emission occurred at 560–590 nm, with very little signal observed in the blue range (470–500 nm). C: in contrast to NAD(P)H, FP signals showed no detectable change in intensity in response to the respiratory chain uncoupler FCCP (1 µM) or inhibitor cyanide (5 mM). Scale bars = 20 µm. FCCP, carbonyl cyanide-4-(trifluoromethoxy)phenylhydrazone.

