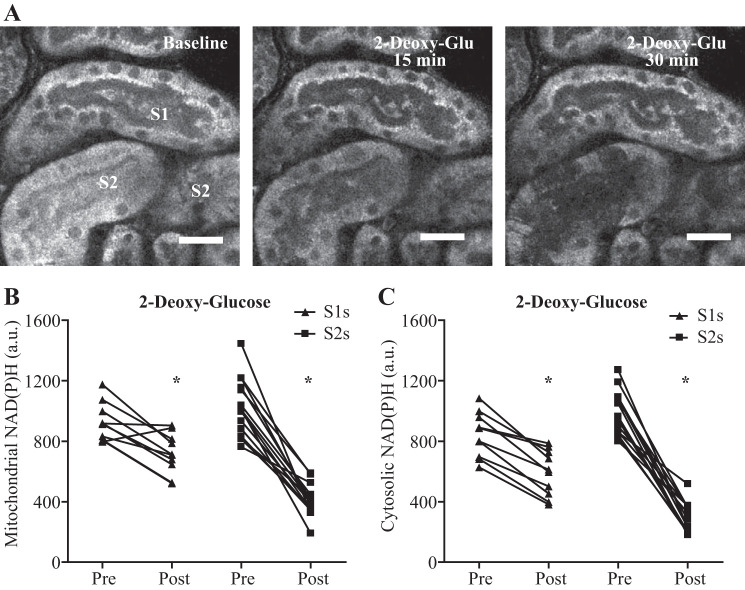
Fig. 7.
Segment (S)1 and S2 proximal tubule segments respond differentially to inhibition of glucose metabolism. A–C: inhibition of glucose metabolism with 2-deoxy-glucose decreased the mitochondrial and cytosolic NAD(P)H signal in both S1 and S2 proximal tubule (PT) segments, but the response was more dramatic in S2. Data are presented as fluorescence intensity values of single tubules pre- and 35 min post-2-deoxy-glucose (n = 10–14). P < 0.05 for mitochondrial and cytosolic NAD(P)H in S1s before vs. after paired t-test. P < 0.0001 for mitochondrial and cytosolic NAD(P)H in S2s before vs. after paired t-test. Scale bars = 20 µm.

