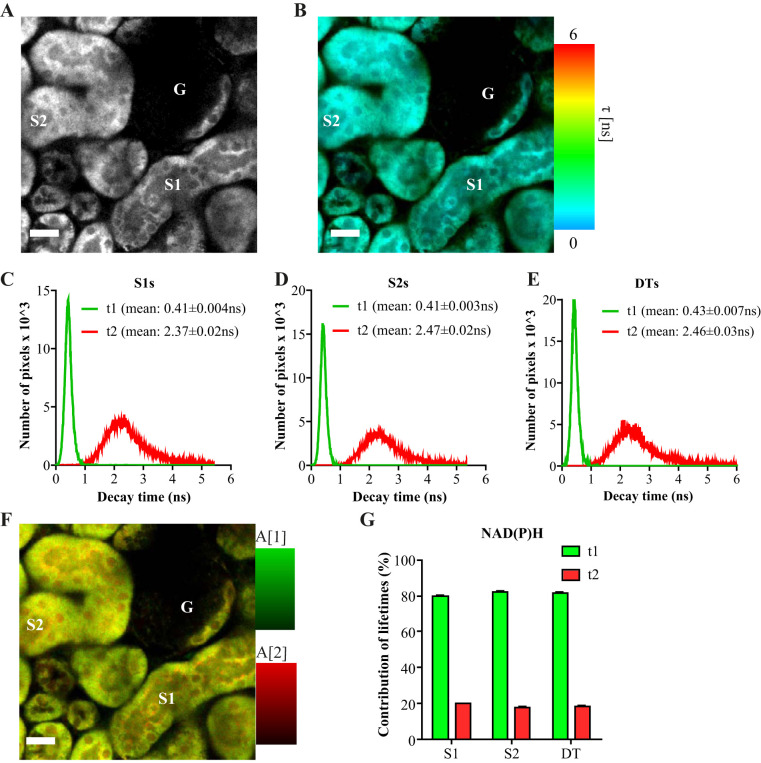
Fig. 8.
Fluorescence lifetime imaging of NAD(P)H signal in kidney tubules. A: image depicting NAD(P)H signal intensity at 720-nm excitation and 435–485-nm emission in proximal tubules (PTs) and a glomerulus (G). B: fluorescence lifetime microscopy (FLIM) image of the same region, showing the average decay time (τ) of NAD(P)H signal in false colors after fitting with a biexponential decay curve. The image reveals a mixture of contributing fluorophores in every pixel. C–E: histograms showing the distribution of the fluorescence lifetimes in segment (S)1 and S2 PTs, and in distal tubules (DTs), revealing two predominant lifetimes in all (τ1 and τ2), one short and one long, most likely reflecting free and bound NAD(P)H, respectively. Data are presented as mean ± SE decay values of single tubules (n = 10–21). F: example FLIM image depicting the contributions of the two major NAD(P)H lifetimes in PTs. G: mean contribution of fluorescence lifetimes (τ1 and τ2) in S1, S2, and DTs. In all of the observed segments, the short component (τ1) accounted for ~80% of the total signal, whereas the long component (τ2) accounted for only ~20% (n = 10–21). Scale bars = 20 µm. ns, not significant.

