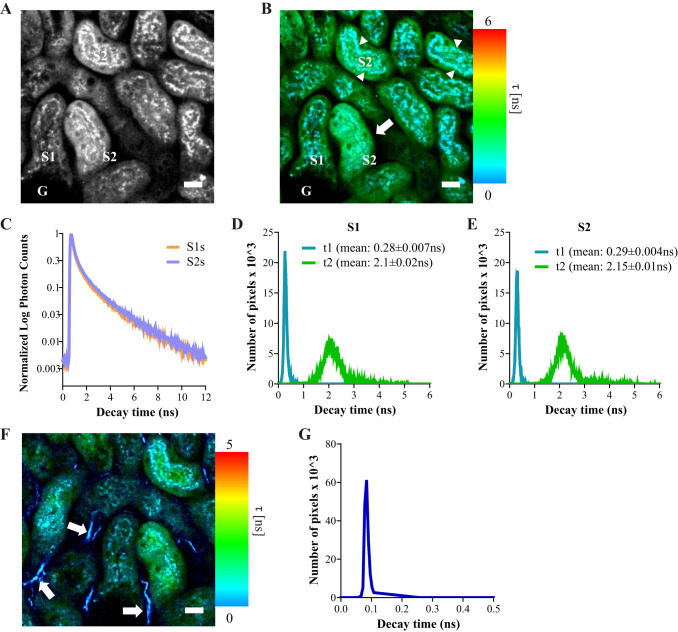
Fig. 9.
Fluorescence lifetime imaging of flavoprotein (FP) signals in kidney tubules. A: image depicting mitochondrial FP signal intensity at 900-nm excitation and 500–550-nm emission in proximal tubules (PTs). B: fluorescence lifetime microscopy (FLIM) image of the same region showing the average decay time (τ) of the tubules in false colors after fitting with a biexponential decay curve. Two different lifetimes were observed, one shorter (τ1) corresponding to the vesicular signal in lysosomes (arrowheads) and one longer (τ2) in the mitochondria (arrow). C–E: histograms showing similar distributions of the decay times and fluorescence lifetimes (τ1 and τ2) in both S1 segments and S2 PT segments. Data are presented as mean ± SE decay values of single tubules (n = 10). F: at 900-nm excitation a lifetime was also detected in the blue range originating from nontubular structures (arrows), most likely representing a second harmonic signal from interstitial collagen fibers. G: the histogram of the blue signal revealed a lifetime much shorter than those observed for endogenous fluorophores. Scale bars = 20 μm.

