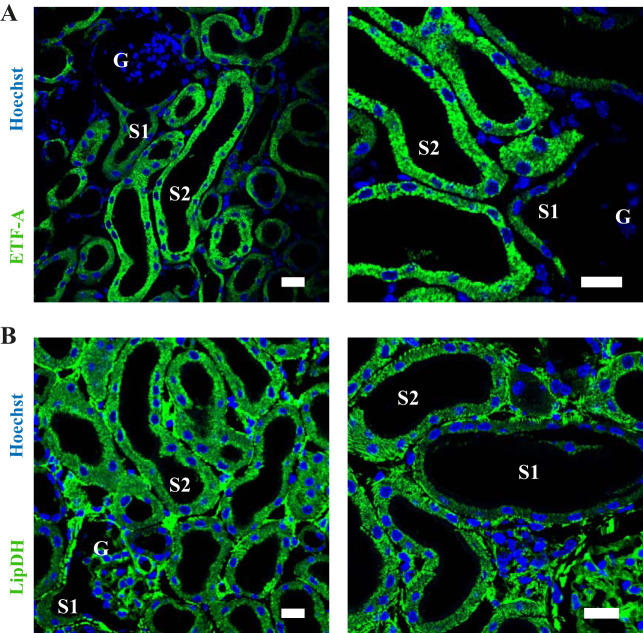
Fig. 10.
Expression levels of fluorescent mitochondrial flavoproteins (FPs) in kidney proximal tubules (PTs). A: antibody staining of fixed kidney cortex sections for the ETF revealed a basolateral striated expression pattern in PTs, consistent with a mitochondrial localization. Expression levels were higher in segment (S)2 than in S1. B: the expression pattern of LipDH in PTs was also consistent with a mitochondrial localization, and expression levels were also higher in S2 than S1. Scale bars = 20 μm. ETF, electron transfer FP; LipDH, lipoamide dehydrogenase.

