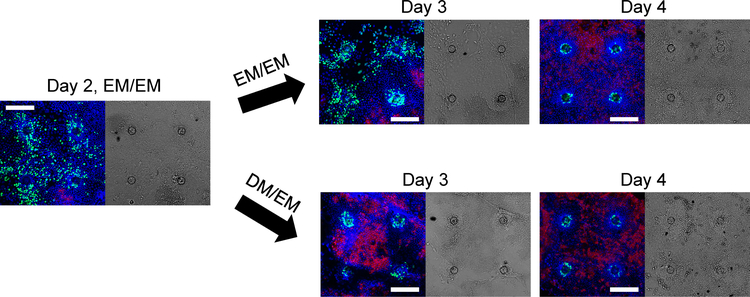
Figure 2.
The time course of intestinal epithelial cell growth across the collagen-coated 1002F film of four microholes in an array. Confocal microscopy images along a single XY plane were taken on day 2, 3 and 4 with the media conditions indicated in the images (see also Table 1). Left panels are overlaid fluorescence images with green, red, blue representing EdU-incorporation, ALP activity and DNA-Hoechst 33342, respectively. Right panels are differential interference contrast images. After 2 days of growth in EM/EM, the media was switched to either fresh EM/EM or DM/EM. The white scale bar represents 200 μm with all images at the same magnification.

