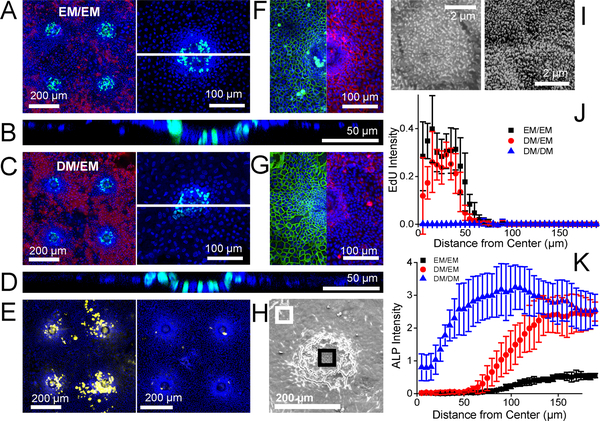
Figure 3.
Primary murine intestinal epithelial cell growth on the microdevice. A-D) Representative confocal fluorescence microscopy images of the cells on the array under EM/EM (A,B) or DM/EM (C,D). Left panels in A, C: Projected image of four planar crypts. Green, red, and blue represent EdU-incorporation, ALP activity and Hoechst 33342, respectively. Right panels in A, C: Projected images of a single planar crypt at higher magnification. The dashed white lines mark the locations of the cross-sectional confocal views through the monolayers shown in B and D. Green and blue represent EdU and Hoechst 33342, respectively. E) Fluorescent images of four planar crypts under DM/EM with yellow and blue representing mucin-2 (left panel) or chromogranin A (right panel) and Hoechst 33342, respectively. F-G) Projected split images of E-cadherin and β-catenin immunofluorescence staining of a single planar crypt under EM/EM (F) or DM/EM (G). Green, red and blue represent E-cadherin, β-catenin and Hoechst 33342. Each image was taken individually and then stitched at the same scale. H) Representative scanning electron microscopy image of a single planar crypt under DM/EM. Black and white boxes indicate the center region and the edge regions of the crypt shown at higher magnification in panel I. I) Representative high magnification SEM images of different regions in the planar crypt: cells over the center (left panel) or at the edge (right panel) of the crypt. J-K) Normalized fluorescence intensity of incorporated EdU (J) and ALP activity (K) in the radial direction outward from the center of the hole located at X = 0. The data points reflect the average and error bars the standard deviation (n=5). The fluorescence of a fluorescence image was measured in concentric rings of width 5 μm from the microhole center.

