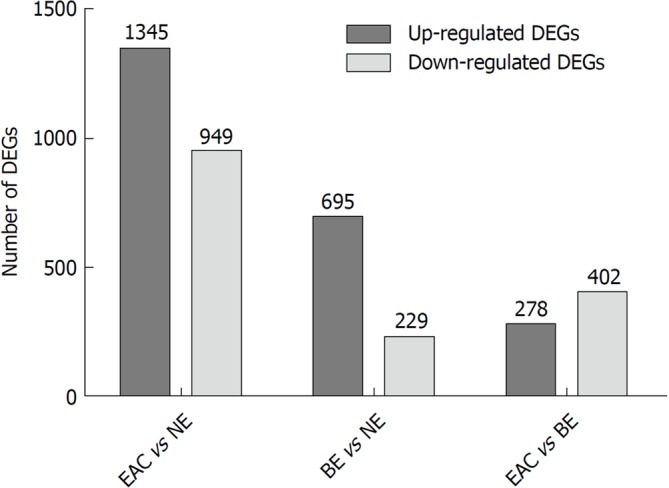
Figure 1.

The numbers of differentially expressed genes in different comparison groups (esophageal adenocarcinoma vs normal esophagus, Barrett's esophagus vs normal esophagus, and esophageal adenocarcinoma vs Barrett's esophagus) in the GSE1420 dataset. The GSE1420 dataset consists of three different groups [normal esophagus (NE), Barrett's esophagus (BE), and esophageal adenocarcinoma (EAC)]. The differentially expressed genes (DEGs) in different comparison groups (EAC vs NE, BE vs NE, and EAC vs BE) were identified using the R/Bioconductor software (|FC| > 1.5, P-values < 0.05), and the numbers of DEGs in different comparison groups were summarized.
