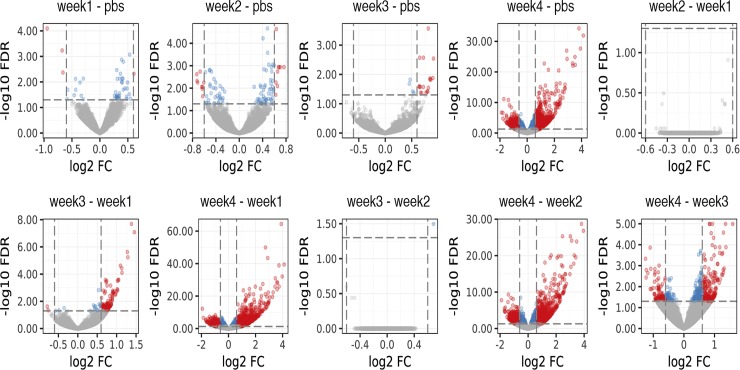
Fig. 2.
Volcano plots of differentially expressed (DE) genes in individual comparisons. Plots demonstrate large shift in proportion of DE genes at the 4 wk tumor-bearing time point with smaller numbers of DE genes among all other comparisons. DE was defined as FDR < 0.05 and Log2(Fold Change) > 0.6, all DE genes denoted by red color. Blue color denotes a gene that reached an FDR < 0.05, but Log2(Fold Change) was not >0.6.

