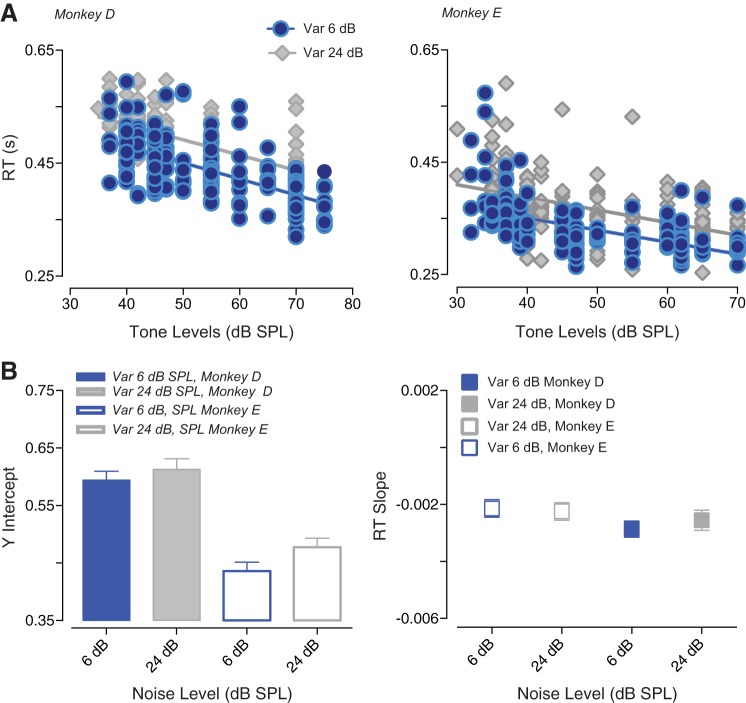
Fig. 6.
Reaction times (RTs) as a function of tone levels for two different variances (widths of the high-probability region). A: averaged data for two monkeys. Blue symbols show RTs for 6-dB variance, and gray symbols show RTs for 24-dB variance. B: summary of y-intercepts and RT slopes for both monkeys. Error bars represent the 95% confidence interval.

