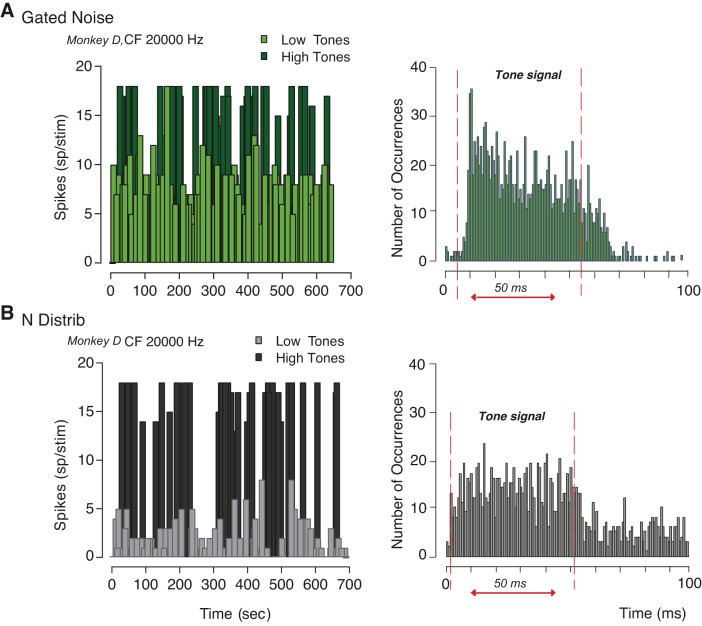
Fig. 9.
Example of inferior colliculus (IC) neuronal responses as function of time. A: spiking activity for both low tones and high tones (left) and peristimulus time histogram (right) when the masker was gated with the signal. The threshold for low-high tones corresponded to the tone level at which the rate level function started to increase from its baseline. B: neuronal response of the same neuron to tones (both low and high) within a distribution of noise amplitudes as function of time (left). The peristimulus time histogram is shown (right) in the same format as A. Neuronal adaptation was observed when low tones were played and was largely induced by the phasic component of the stimulus.

