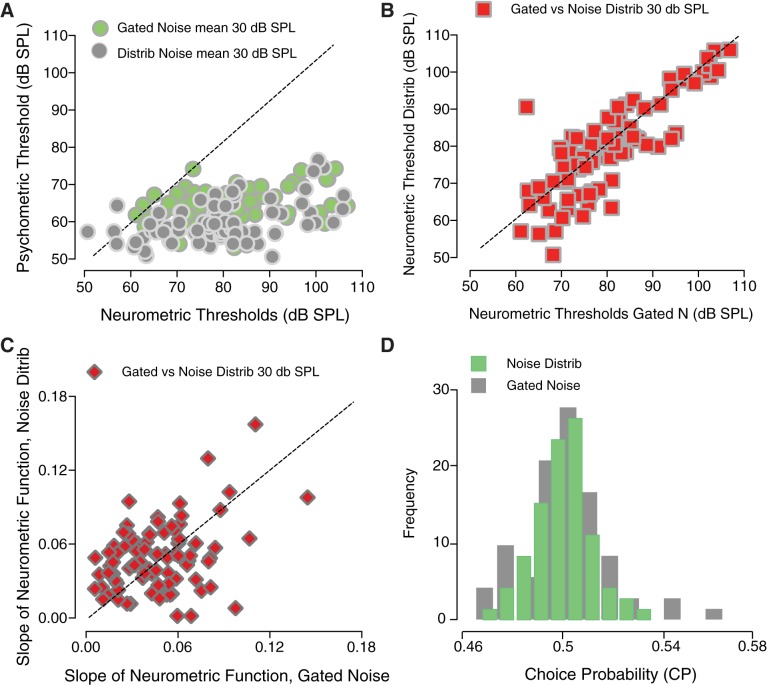
Fig. 10.
Relationship between behavioral and neurophysiological responses. A: psychometric thresholds versus neurometric thresholds for distribution noise with a mean of 30 dB sound pressure level (SPL) (gray symbols) and simultaneously gated noise at 30 dB SPL spectrum level (green symbols). B: neurometric thresholds (red squares) obtained in continuous distribution noise versus simultaneously gated noise as a function of noise level. C: neurometric slopes (red diamonds) in continuous distribution noise are plotted against those obtained in gated noise. D: histograms of choice probability (CP). CPs are shown for gated noise (green) and noise distribution (gray) backgrounds. The tone frequency used for behavioral testing always coincided with the characteristic frequency of each neuron.

