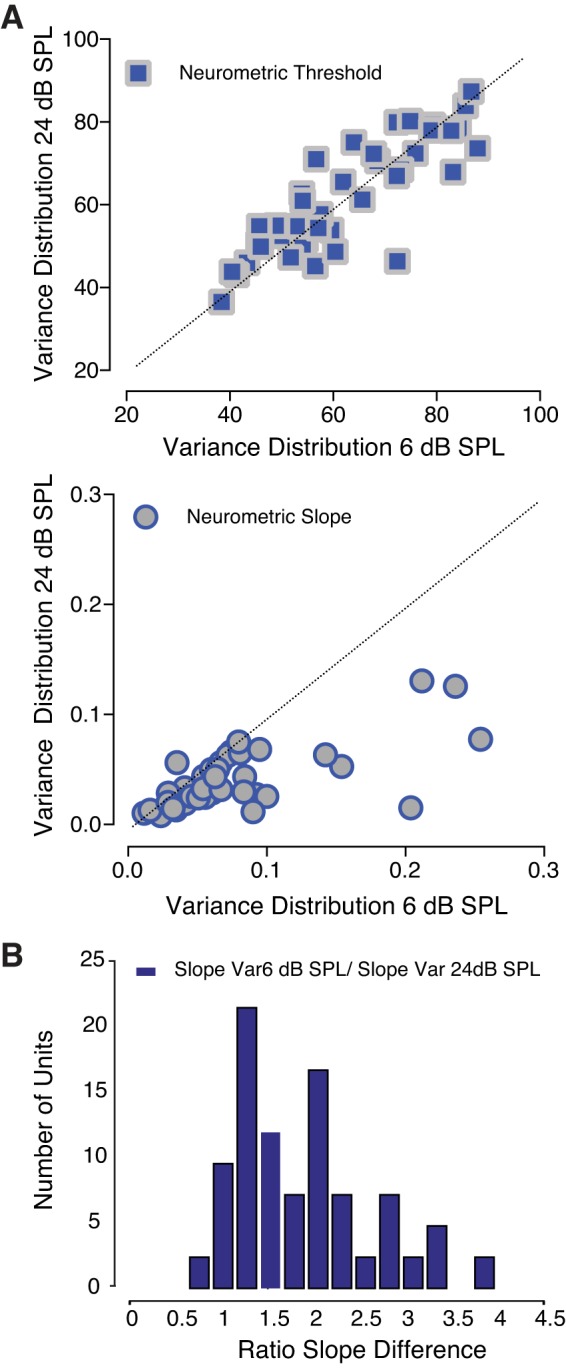
Fig. 11.

Neuronal responses to changes within the variance of the distribution. A: neurometric thresholds were independent of the width of the distribution high-probability region (blue squares). The slope of the neurometric function (gray circles) was significantly higher when the variance of the distribution was relatively low [6 dB sound pressure level (SPL)]. B: histogram shows the ratio of the slope differences between the two conditions.
