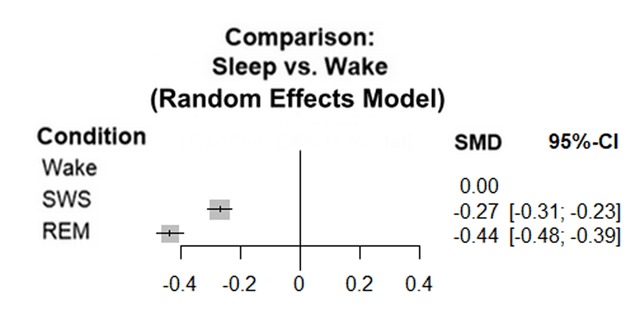
Figure 2.

Network meta-analysis comparing serotonin levels during wakefulness, SWS and REM sleep.
This plot summarises the results of 26 studies; 19 had data for each stage, 7 had data only for wakefulness and SWS. For the overall effect, p < 0.0001. The analysis shows significant heterogeneity; Τ² = 0.0059; I² = 98.4%.
Abbreviations: SWS: Slow Wave Sleep; REM: Rapid Eye Movement sleep.
