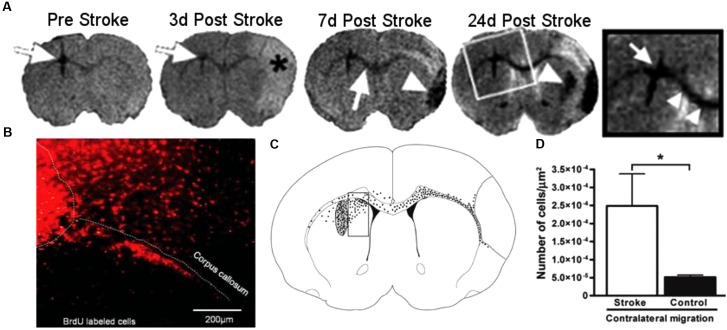
FIGURE 4.
Magnetic resonance imaging (MRI) of NPCs migrating to stroke (Guzman et al., 2008, reproduced with permission). The top panel (A) shows a representative MRI of animals injected with NPCs before and over 24 days after the induction of stroke. White arrows show the location of labeled cells, moving from the site of injection to the area of stroke, denoted with an asterisk (∗). The bottom panel (B–D) shows the histology of animals 24 days after stroke. Cells labeled with BrdU (red, B) were observed migrating away from the site of injection and into the corpus callosum. To quantify the migration, the area adjacent to the injection site was analyzed by counting cells in a counting box (C). The graph shows significantly greater migration away from the injection site in animals that received a stroke than the sham controls. Reproduced with permission.

