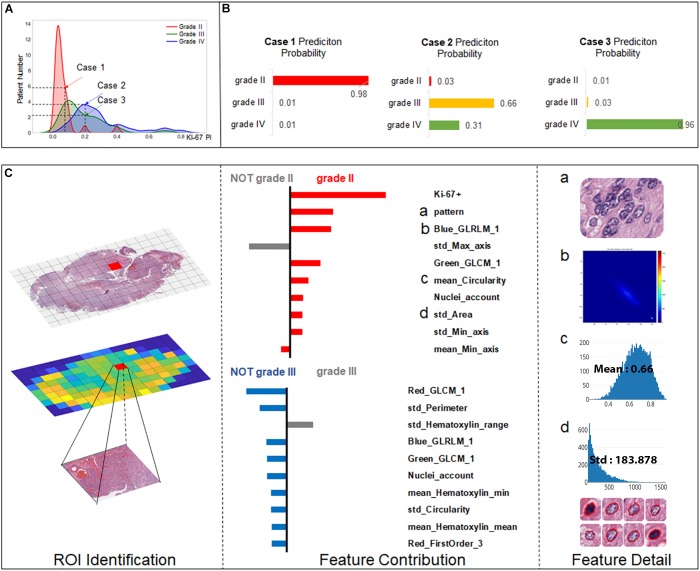
FIGURE 5.
Grading result explanation of representative cases with the LIME algorithm for the SVM model (part 1) (A) Distribution of Ki-67 by different grades. Three selected cases had Ki-67 PI values of 0.08, 0.2, and 0.2. (B) Prediction probability for 3 cases. (C) Glioma Case 1 for grade II with a Ki-67 PI value of 0.08, and Ki-67 PI was the dominant feature.

