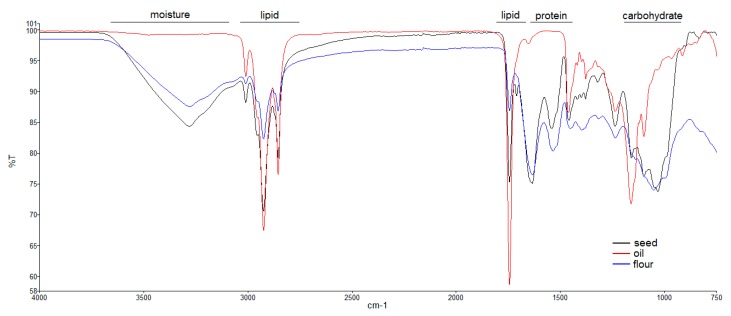
Figure 4.
Comparative ATR-FTIR spectroscopy analysis of the three edible hemp products (Fedora cv): Seed, oil, and flour. The spectral regions specific to macronutrients (lipids, proteins, and carbohydrates) are indicated in the figure. Protein amines also contribute to the bands in the 3500–3000 cm−1 spectral region, indicated as “moisture”.

