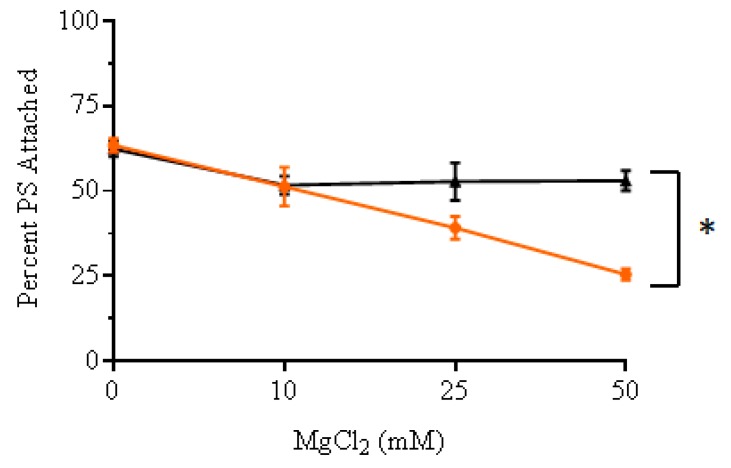
Figure 7.
Trend of cellular interaction between cationic porphyrins 3 (black) and 4 (orange) and E. coli cells as a function of increasing concentration of Mg+2 ions, source MgCl2 (0, 10, 25, 50 mM). The percentage of PS attached was calculated as a percentage of the original PS concentration (1 µM). Values represent the average of three independent experiments. Error bars represent one standard of deviation. Statistical analysis was performed by one-way ANOVA (* p < 0.05).

