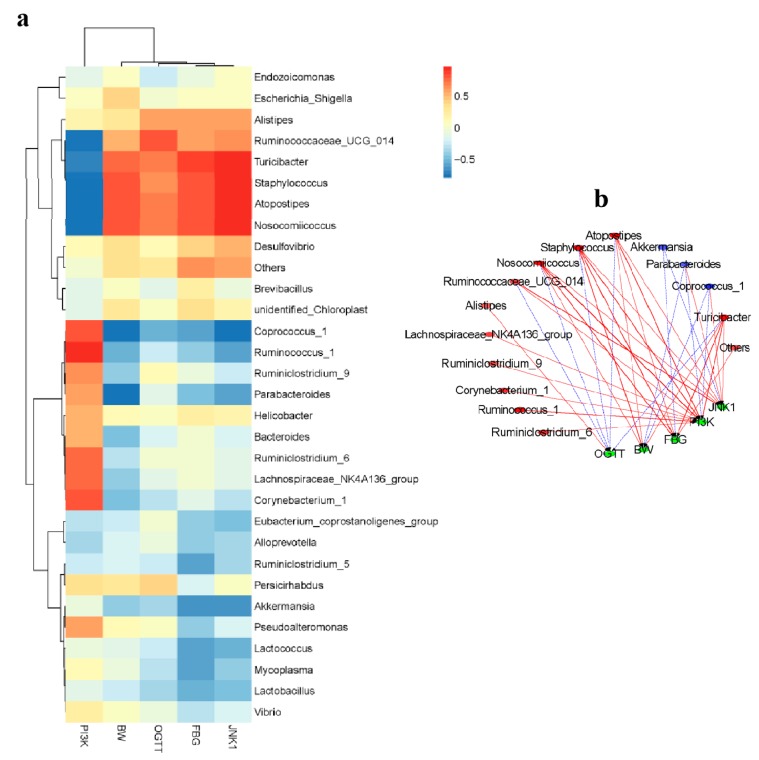
Figure 5.
(a) Analysis of heat map of gut microbiota with biochemical indexes and mRNA expression levels. Red region represents positive correlation, blue region represents negative correlation, and the shades of color indicates the strength of relevance among them. (b) Analysis of network of gut microbiota, biochemical indexes, and gene expression levels. The solid red line and dotted blue line represented positive and negative correlation, respectively. In addition, the line width indicated the strength of correlation; the edges were drawn in the network using the Spearman correlation (|r| > 0.6).

