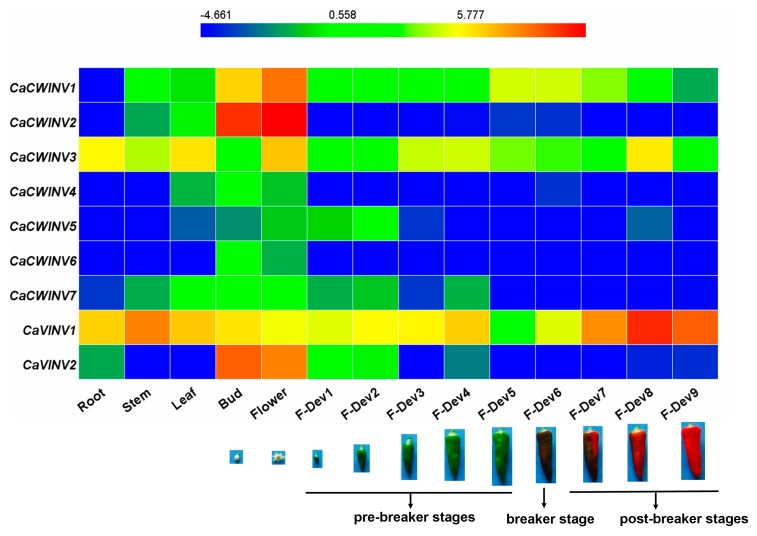
Figure 8.
Expression profiles of nine pepper CaAINV genes in different tissues and developmental stages. The expression data were collected from Illumina RNA-sequence data from the genome sequences of the pepper cultivar, Zunla-1, [12]. Images of pepper fruit developmental stages were cited from Qin et al. [12]. The fragments kilobase of exon model per millon mapped reads (FPKM) values were log2 transformed and the heat map was generated using the HemI (Heatmap Illustrator, version 1.0) software package. The bar at the top represents log2-transformed values. Genes, highly or weakly expressed, in various tissues are colored blue and red, respectively.

