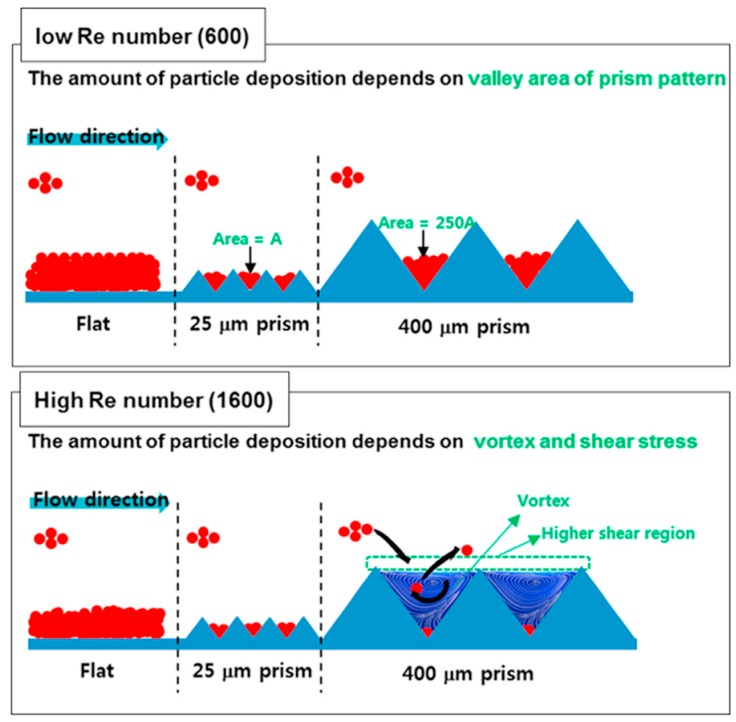
Figure 3.
An illustrative scheme of correlation of membrane fouling with topography of profiled membranes in cross-flow filtration for water treatment. Re stands for Reynolds number. Particles are represented in red and the prismatic membrane surface pattern by blue triangles. The bending arrows illustrate particles entering and leaving locally created flow vortexes Reproduced with permission from Reference [33]. Copyright 2016 Elsevier.

