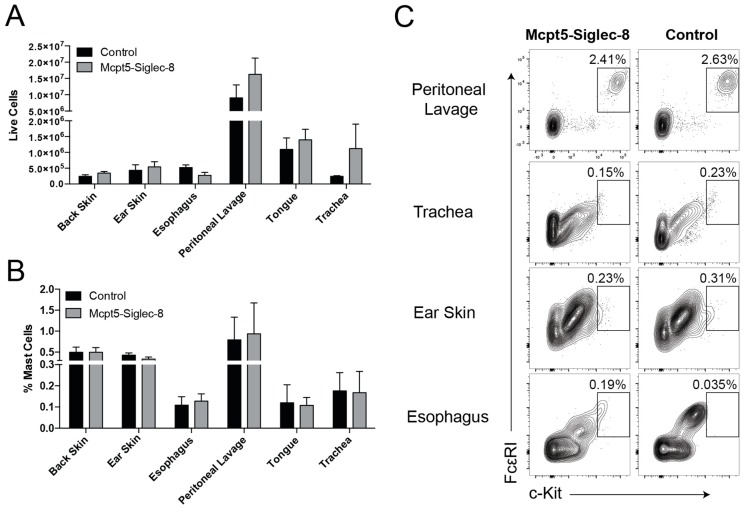
Figure 3.
Equal mast cell numbers in control and Mcpt5-Siglec-8 mice across multiple tissues. (A) Quantification of total live cells isolated from various tissues; (B) average frequency of mast cells (CD45+ CD11b− FcεRI+ c-Kit+ of live cells) in the tissues of Mcpt5-Siglec-8 (Mcpt5-Cre+/− SIG8+/−, n = 3) and control (n = 4: WT, n = 1 and Mcpt5-Cre−/− SIG8+/−, n = 3) mice; and (C) representative flow cytometry plots of dispersed tissues showing live CD45+ CD11b− cells with a gate for FcεRI+ c-Kit+ cells. Data in (A) and (B) are from three independent experiments, and the mean ± SEM of n = 3–4 are displayed. No significant differences between the groups were identified (two-way ANOVA).

