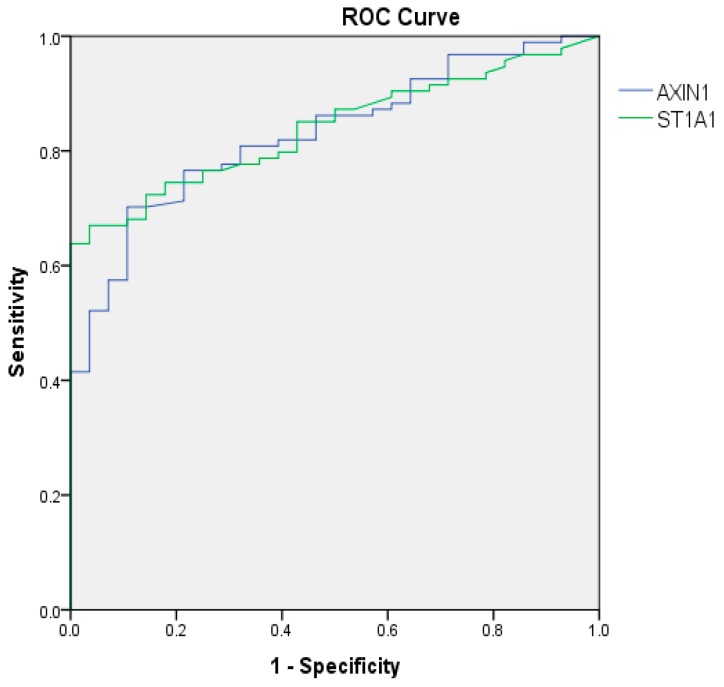
Figure 2.
Receiver operating characteristic (ROC) curves of the most significantly elevated expressed proteins in endometriosis compared to controls. ROC = receiver operating characteristics, ST1A1 = sulfotransferase 1A1. ROC curves are calculated by comparing endometriosis patients (N = 94) to healthy controls (N = 28). The area under curve (AUC) for AXIN 1 was 0.830 (95% confidence interval (CI): 0.755–0.904), p < 0.001 and AUC for ST1A1 was 0.839 (95% CI: 0.771–0.908), p < 0.001.

