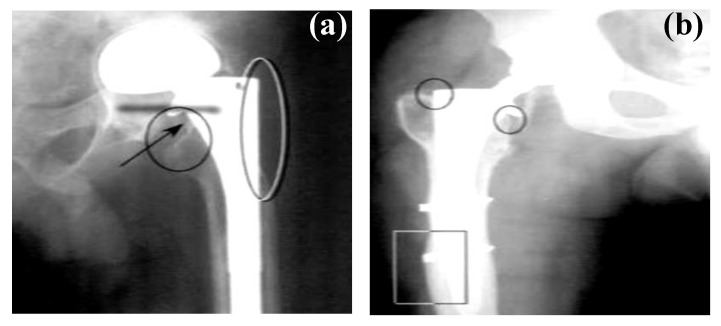
Figure 2.
Radiographs of hip implants showing changes in bone mass due to stress shielding around an implant: (a) bone loss at the proximal region (indicated in the circled regions at the edge of the prosthesis) and (b) bone deposition (indicated by the rectangle) in the distal region of the implant . Obtained from [23], with permission from Wiley online library, 2018.

