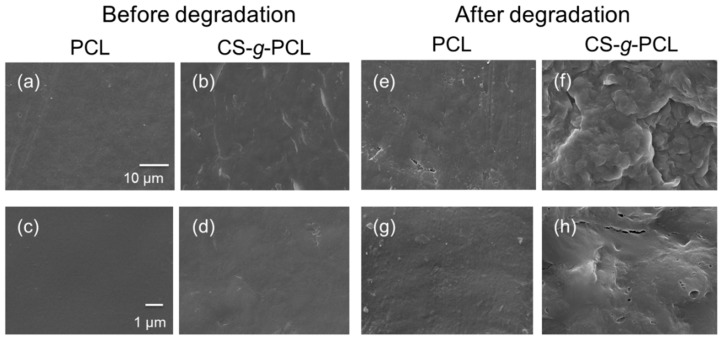
Figure 6.
SEM images of the PCL and CS-g-PCL disc samples as prepared (a,c and b,d, respectively) and after 21 days of degradation in α-ΜΕΜ (e,g and f,h, respectively). Top panel: 2000-fold magnification, scale bar represents 10 μm; bottom panel: 10,000-fold magnification, scale bar represents 1 μm.

