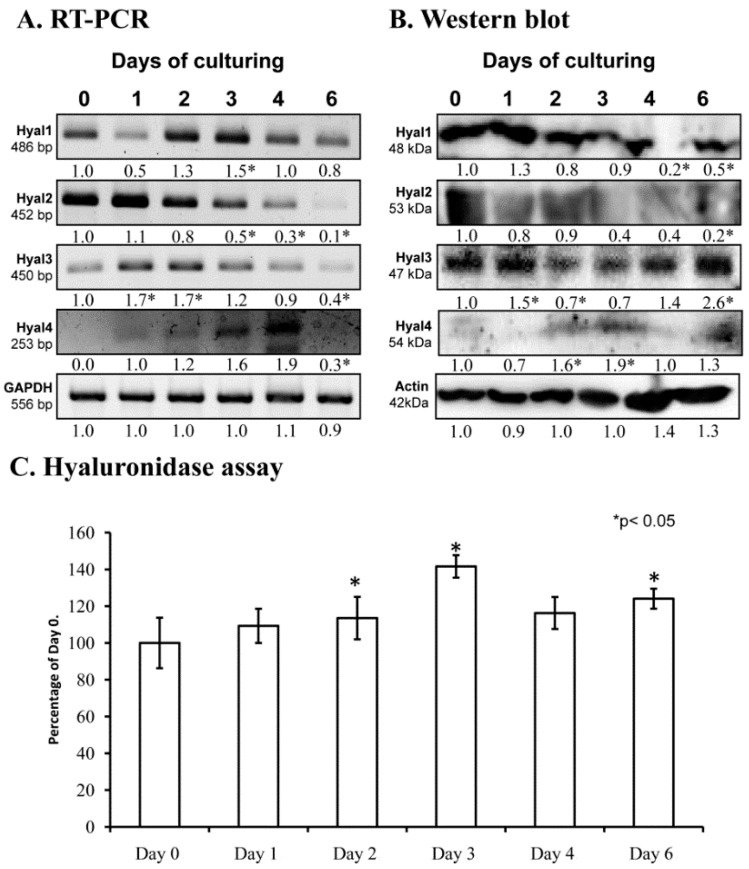
Figure 1.
mRNA (A) and protein (B) expression of hyaluronidases in chondrifying micromass cultures. Optical densities of signals were measured and results were normalized to the optical densities of 0-day cultures. In panels (A,B), the numbers below the signals represent integrated densities of signals determined by ImageJ freeware. For reverse transcription followed by polymerase chain reactions (RT-PCR) and Western blot reactions, glyceraldehyde 3-phosphate dehydrogenase (GAPDH) (A) or actin (B) were used as internal controls. Hyaluronidase activity in micromass cultures (C). Densities and means of three independent experiments (± standard error of the mean) are shown in the figures. Asterisks indicate significant differences compared with the 0-day cultures (* p < 0.05, one-way analysis of variance (ANOVA) followed by Tukey’s honestly significant difference (HSD) test).

