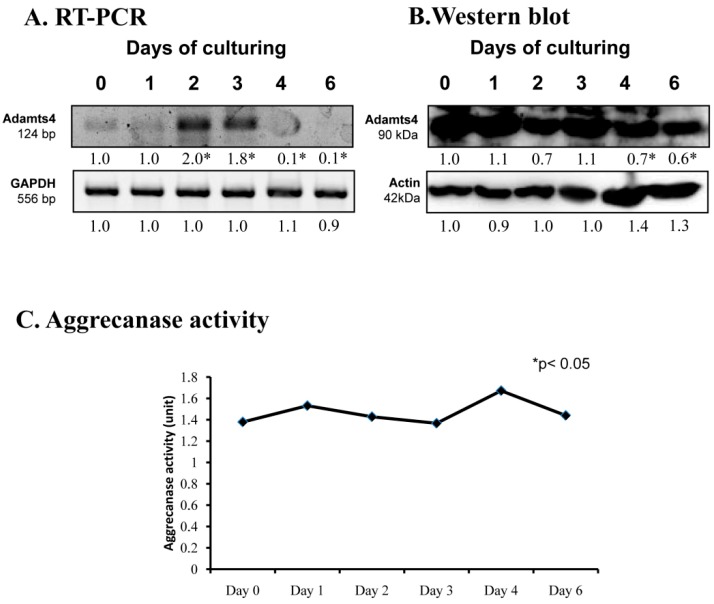
Figure 3.
mRNA (A) and protein (B) expression of ADAMTS4 in chondrifying micromass cultures. Optical densities of signals were measured and results were normalized to the optical densities of 0-day cultures. In panels (A,B), the numbers below the signals represent integrated densities of signals determined by ImageJ freeware. For RT-PCR and Western blot reactions, GAPDH (A) and actin (B) were used as internal controls. Aggrecanase activity (C) was also determined in chondrifying micromass cell cultures. Densities and means of three independent experiments (±standard error of the mean) are shown in the figures. Asterisks indicate significant differences compared with the 0-day cultures (* p < 0.05, one-way ANOVA followed by Tukey’s HSD test).

