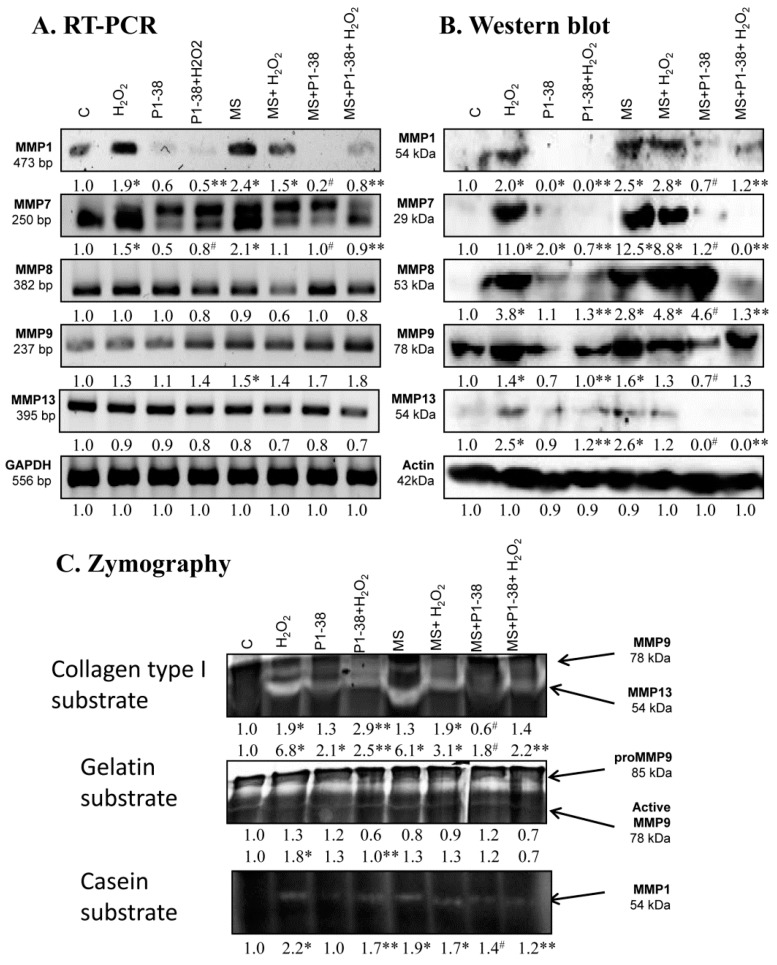
Figure 6.
Effects of PACAP and/or oxidative stress and/or mechanical stress (MS) on mRNA (A) and protein (B) expression of matrix metalloproteinases in chondrifying micromass cultures. Optical densities of signals were measured and results were normalized to the optical densities of three-day cultures (C). In panels (A,B), the numbers below the signals represent integrated densities of signals determined by ImageJ freeware. For RT-PCR and Western blot reactions, GAPDH (A) and actin (B) were used as internal controls. Zymography (C) with collagen type I, gelatin, and casein substrates was also performed during PACAP treatments, oxidative stress, mechanical stress, and combinations of the three. Signals for MMP9 at 75 kDa, MMP13 at 54 kDa, proMMP9 at 85 kDa, and MMP1 at 54 kDa are labeled. Densities and means of three independent experiments (±standard error of the mean) are shown in the figures. Asterisks indicate significant differences compared with the three-day cultures (p < 0.05, one-way ANOVA followed by Tukey’s HSD test). Where ANOVA reported significant differences among the groups (p < 0.05), a post hoc test (multiple comparison versus control group, Tukey’s HSD method) was used to isolate the groups that differed from the control group at p < 0.05. The respective control group was the untreated control when comparison was made between control, H2O2-treated, PACAP 1-38-treated, and mechanically stressed groups, whereas the H2O2-treated cultures were used as control in the post hoc test when comparison was made between H2O2-treated, H2O2+PACAP 1-38-treated, and H2O2+mechanically stressed samples. * shows significant differences between control cultures and treated samples; ** shows significant differences between single-H2O2 treatment and combined treatments; # shows significant differences between single-MS treatment and combined treatments.

