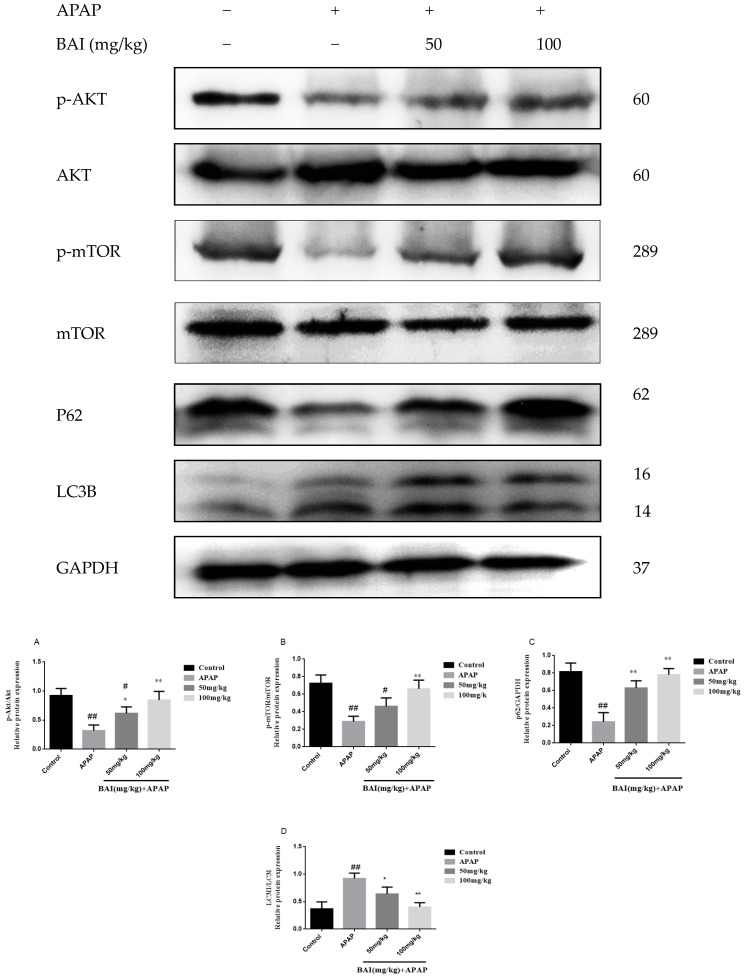
Figure 7.
Effects of BAI on p-AKT, AKT, p-mTOR, mTOR, P62and LC3B protein expression. Protein samples were extracted from liver tissue homogenates and analyzed by western blot. Effects of BAI on APAP-induced p-AKT, AKT, p-mTOR, mTOR, P62and LC3B in liver and statistical analysis of p-AKT, AKT, p-mTOR, mTOR, P62and LC3B protein expression (A–D). Control, APAP group; 50 mg/kg, 100 mg/mg BAI group; All data are expressed as mean ± S.D., n = 3. ** p <0.01, * p < 0.05 compared with model group; ## p < 0.01, # p < 0.05 compared with control group.

