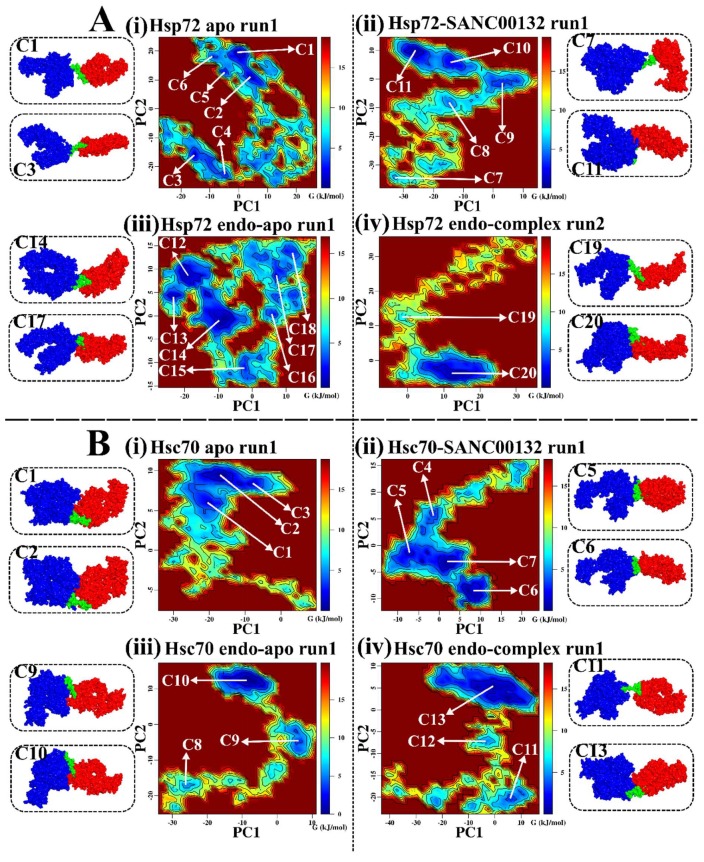
Figure 3.
(A,B) 2D projections of free energy landscape along the first and second principal components. Comparisons between SANC00132-free and SANC00132-bound systems. Surfaces are coloured based on Gibbs free energy levels from maroon (high energy/maxima) to blue (low energy/minima). Each contour represents an increase of the free energy of 1 kJ·mol−1. Conformations sampled are labelled from C1–C20 (Hsp72) and C1–C11 (Hsc70), respectively. Snapshots of representative conformations occupying important free energy wells (minima) are shown as surfaces and coloured domain-wise: Blue: NBD, Green: Linker, Red: SBD. A: Hsp72: (i) Hsp72 apo Run1, (ii) Hsp72-SANC00132 Run1, (iii) Hsp72 endo-apo Run1, (iv) Hsp72 endo-complex Run2. B: Hsc70: (i) Hsc70 apo Run1, (ii) Hsc70-SANC00132 Run1, (iii) Hsc70 endo-apo Run1, (iv) Hsc70 endo-complex Run2. Duplicate trajectory results are shown in the Supplementary Data (Figure S5).

