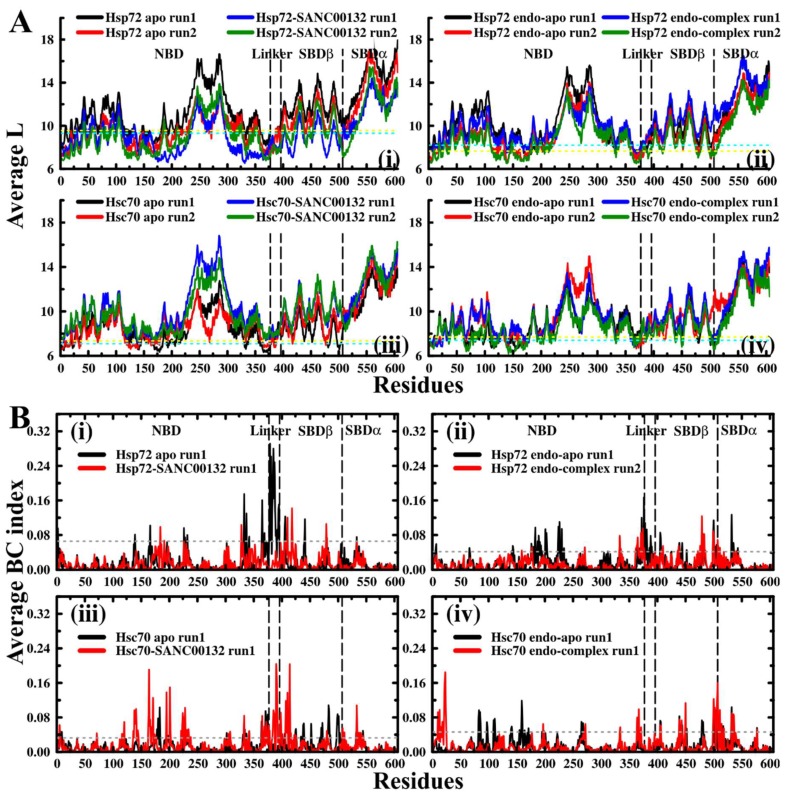
Figure 5.
Contact network analysis: (A) Average shortest path (L) results. Colour key: Black and red: SANC00132-free, blue and green: SANC00132-bound. The upper threshold values of 9.31 (Hsp72 apo run1), 8.17 (Hsp72 apo run2), 8.20 (Hsp72 endo-apo run1), 7.65 (Hsp72 endo-apo run2), 7.09 (Hsc70 apo run1), 7.35 (Hsc70 apo run2), 7.40 (Hsc70 endo-apo run1), and 7.69 (Hsc70 endo-apo run2) are indicated by the dotted lines. Colour code: Cyan: run1, yellow: run2. (B) Betweenness centrality (BC) results. Colour key: Black: SANC00132-free, red: SANC00132-bound. The lower threshold values of 0.07 (Hsp72 apo run1), 0.04 (Hsp72 endo-apo run1), 0.03 (Hsc70 apo run1), and 0.03 (Hsc70 apo run1) are indicated by the grey dotted lines. Results of duplicate trajectories are shown in Figure S7.

