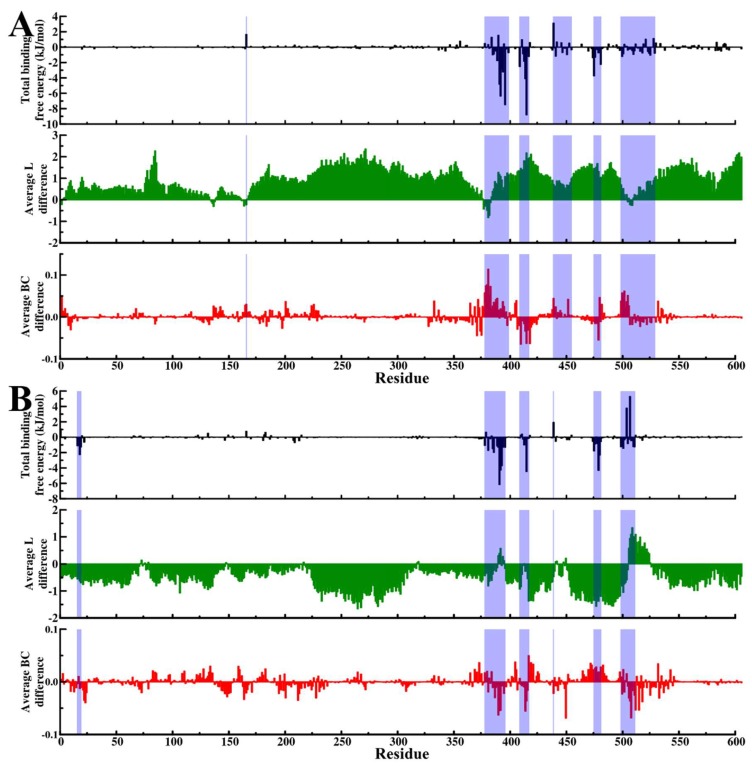
Figure 7.
Effects of ligand binding on residue accessibility and centrality. Graphical mapping of structural regions making significant contribution to total binding free energy (shaded blue) onto plots of average L difference (green) and average BC difference (red). Change in residue accessibility (average L difference) and residue centrality (average BC difference) were obtained from calculations of SANC00132-free less SANC00132-bound values. For each metric, per residue means across both sets (set1 and set2) of experiments was initially calculated. (A) Hsp72, (B) Hsc70.

