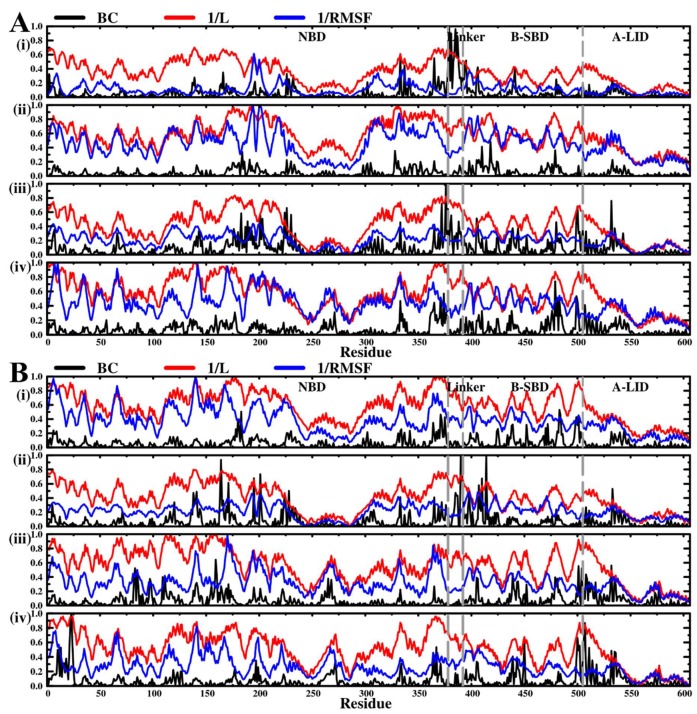
Figure 8.
Graphical illustration of correlation between 1/RMSF, 1/Average L, and Average BC. (A) Hsp72 (B) Hsc70. Pairwise comparisons between 1/BC and 1/L as well as comparisons from duplicate trajectories are found in Supplementary Data (Figure S16 and Figure S17). A: (i) Hsp72 apo run1, (ii) Hsp72-SANC00132 complex run1, (iii) Hsp72 endo-apo run1, (iv) Hsp72 endo-complex run2. B: (i) Hsc70 apo run1, (ii) Hsc70-SANC00132 complex run1, (iii) Hsc70 endo-apo run1, (iv) Hsc70 endo-complex run1.

