Figure 6.
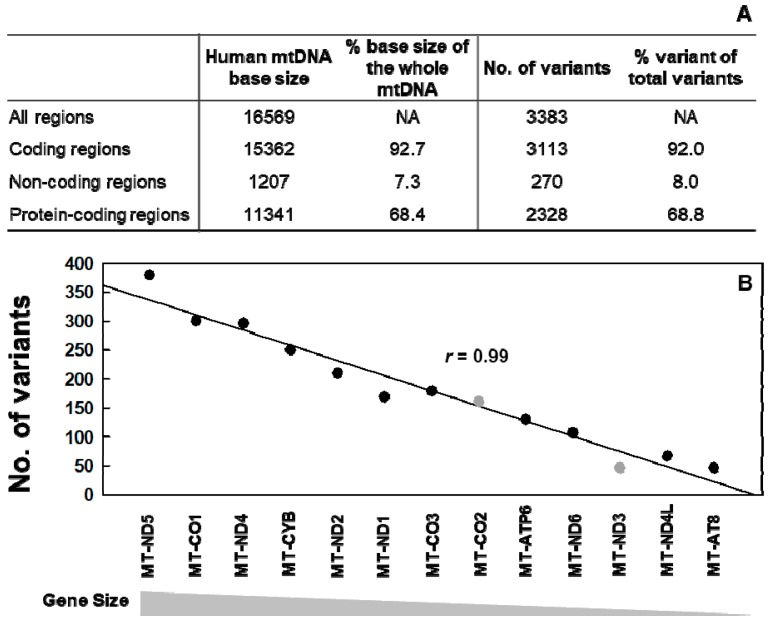
Numbers of the heat-induced (65 °C) artifactual variants in the whole mtDNA of normal human breast cells identified by SSCS and DCS analyses. Variants were counted only once at each position of the genome. (A) Numbers of variants identified in coding, protein-coding, and non-coding regions of mtDNA. The percentage of variants from each region out of the total number of identified variants is calculated (% variants). The percentage of base size that each region occupies out of the total size of mtDNA is calculated (% base size); (B) The numbers of the heat-induced artifactual rare variants identified in each of 13 protein-coding genes of mtDNA are plotted in the order of largest to smallest gene size. The Pearson’s correlation coefficient for each gene size of the 13 genes versus numbers of variants of each gene was 0.99 (p = 2.36 × 10⁻¹⁰).

