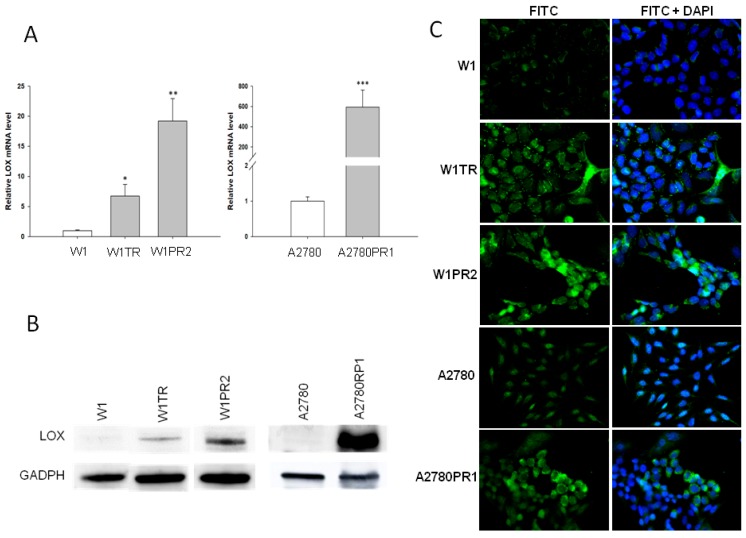
Figure 1.
Expression analysis of (A) LOX transcript (Q-PCR) in the W1, A2780, and drug-resistant cell sublines. The figure presents the relative gene expression in the resistant cell lines (gray bars) with respect to that in the sensitive cell line (white bars), which has been assigned a value of 1. The values were considered significant at * p < 0.05, ** p < 0.01, and *** p < 0.001. (B) LOX protein expression analysis in the W1, A2780, and drug-resistant cell lines. The cellular proteins were separated using 7% PAGE and transferred to a PVDF membrane, which was then immunoblotted with either primary Ab or HRP-conjugated secondary Ab. A primary anti-GADPH Ab was used as a loading control for the cell lysates. (C) LOX immunofluorescence in the W1 and A2780 drug-resistant cell sublines. LOX was detected using the anti-LOX antibody and Alexa Fluor®488-conjugated secondary antibody (green). To visualize the cell nuclei, the cells were mounted with a DAPI-containing mounting medium (blue). Objective 40×.

