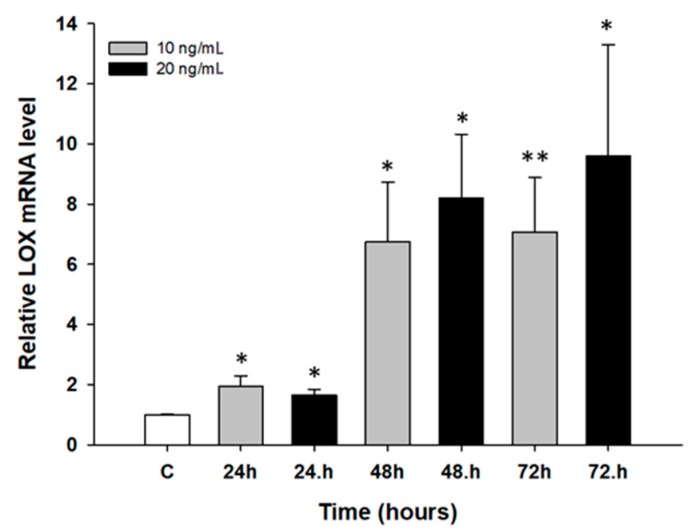
Figure 2.
Expression analysis of the LOX gene in the W1 cell line after short time exposure to PAC. The figure presents relative genes expression in PAC treated cells (gray and black bars) with respect to the untreated control (white bars) assigned as 1. The values were considered significant at * p < 0.05 and ** p < 0.01.

