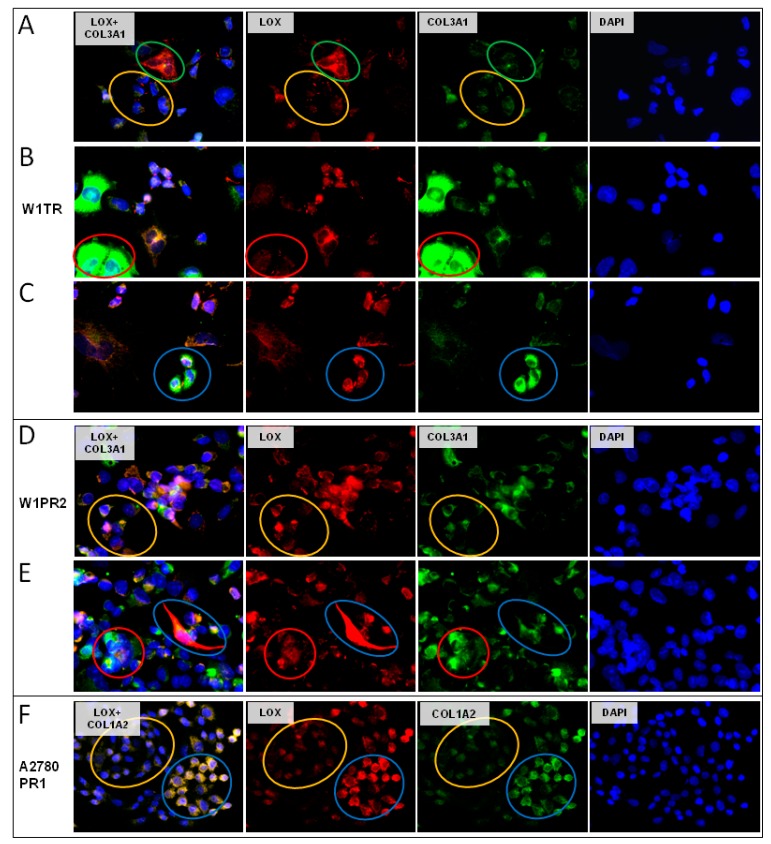
Figure 6.
Immunofluorescence visualization of LOX and COL3A1 coexpression: (A) W1TR—low LOX/low COL3A1, yellow circle and high LOX/low COL3A1, green circle; (B) W1TR—low LOX/high COL3A1, red circle; (C) W1TR—high LOX/high COL3A1, blue circle; (D) W1PR2—low LOX/low COL3A1, yellow circle; (E) W1PR2—low LOX/high COL3A1, red circle; (F) A2780PR1—low LOX/low COL1A2, yellow circle and high LOX/high COL1A2, blue circle. LOX was detected using the anti-LOX antibody and Alexa Fluor®594-conjugated secondary antibody (red). COL3A1 was detected using anti-COL3A1 antibody and Alexa Fluor®488-conjugated secondary antibody (green). To visualize the cell nuclei, the cells were mounted with a DAPI-containing mounting medium (blue). Objective 40×.

