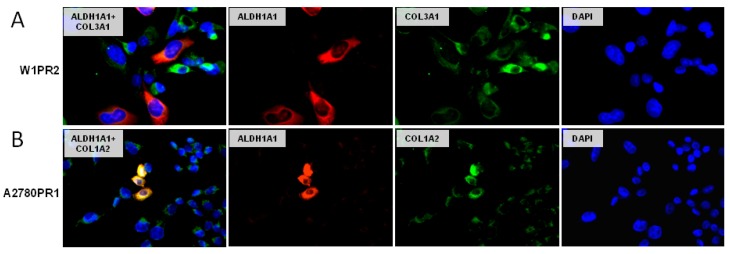
Figure 7.
Immunofluorescence visualization of ALDH1A1 and COL3A1 coexpression in the W1PR2 cell line (A) and coexpression of ALDH1A1 and COL1A2 in the A2780PR1 cell line (B). ALDH1A1 was detected using the anti-ALDH1A1 antibody and Alexa Fluor®488-conjugated secondary antibody (green). COL3A1 and COL1A2 were detected using the anti-COL3A1 and anti-COL1A2 antibodies and Alexa Fluor®594-conjugated secondary antibody (red). To visualize the cell nuclei, the cells were mounted with a DAPI-containing mounting medium (blue). Objective 40×.

